What Is The BCG Matrix? Coca-Cola's BCG Matrix Analysis
For businesses that provide products or services, having the right business strategy is extremely important for the growth and development of the business.
Besides the SWOT matrix, the BCG matrix is useful to assist businesses in long-term strategic product planning.
So what is the BCG matrix? The following article will fully explain the outstanding features and analyze the example of this model in a typical business for you to have a clearer view.
 BCG matrix
What Is The BCG Matrix?
BCG matrix stands for Boston Consulting Group matrix - and is also the global management consulting company that founded the BCG matrix, also known as the Boston matrix or growth matrix - market share.
The BCG Matrix has been used since 1968 to help companies better understand their best products and assist businesses in business model analysis.
From there, you can take advantage of market share growth opportunities and bring competitive advantages to your business. The matrix also helps companies identify potential growth opportunities and make sound investments in the future.
Designed with a layout of 4 squares and two vertical axes - the horizontal axis for the two aspects of market growth and market share, a Boston matrix model will mainly analyze the following strategic business units (SBUs):
Star
The Star in the upper left corner of the matrix diagram represents the product or business unit with the best growth and relatively large market share.
Exclusive and first-to-market products with plenty of opportunity for long-term growth also often rank in this category. However, because of the high growth rate, the products located in Star need a huge investment to maintain their growth rate.
Products in Last Star can become SBU Bulls if the business's growth rate slows down due to not being maintained and invested.
See more: What Is Flowchart? Flowchart Application For Business Process Visualization
Question Mark
Used to denote products with high growth prospects but limited market share. Startups, ventures, and new products often start in the Question mark box because they require a large investment but little return.
SBU Question Dot still has the potential to grow rapidly and can become a Star if managed well and gain more and more product share in the market.
Businesses need to consider carefully before investing in this portfolio, so they should spend money to increase competitiveness with competitors or withdraw to preserve capital.
For example: Apple TV is a new product line from Apple with large market potential but small current market share and profits, so it should be classified in the Question Marks.
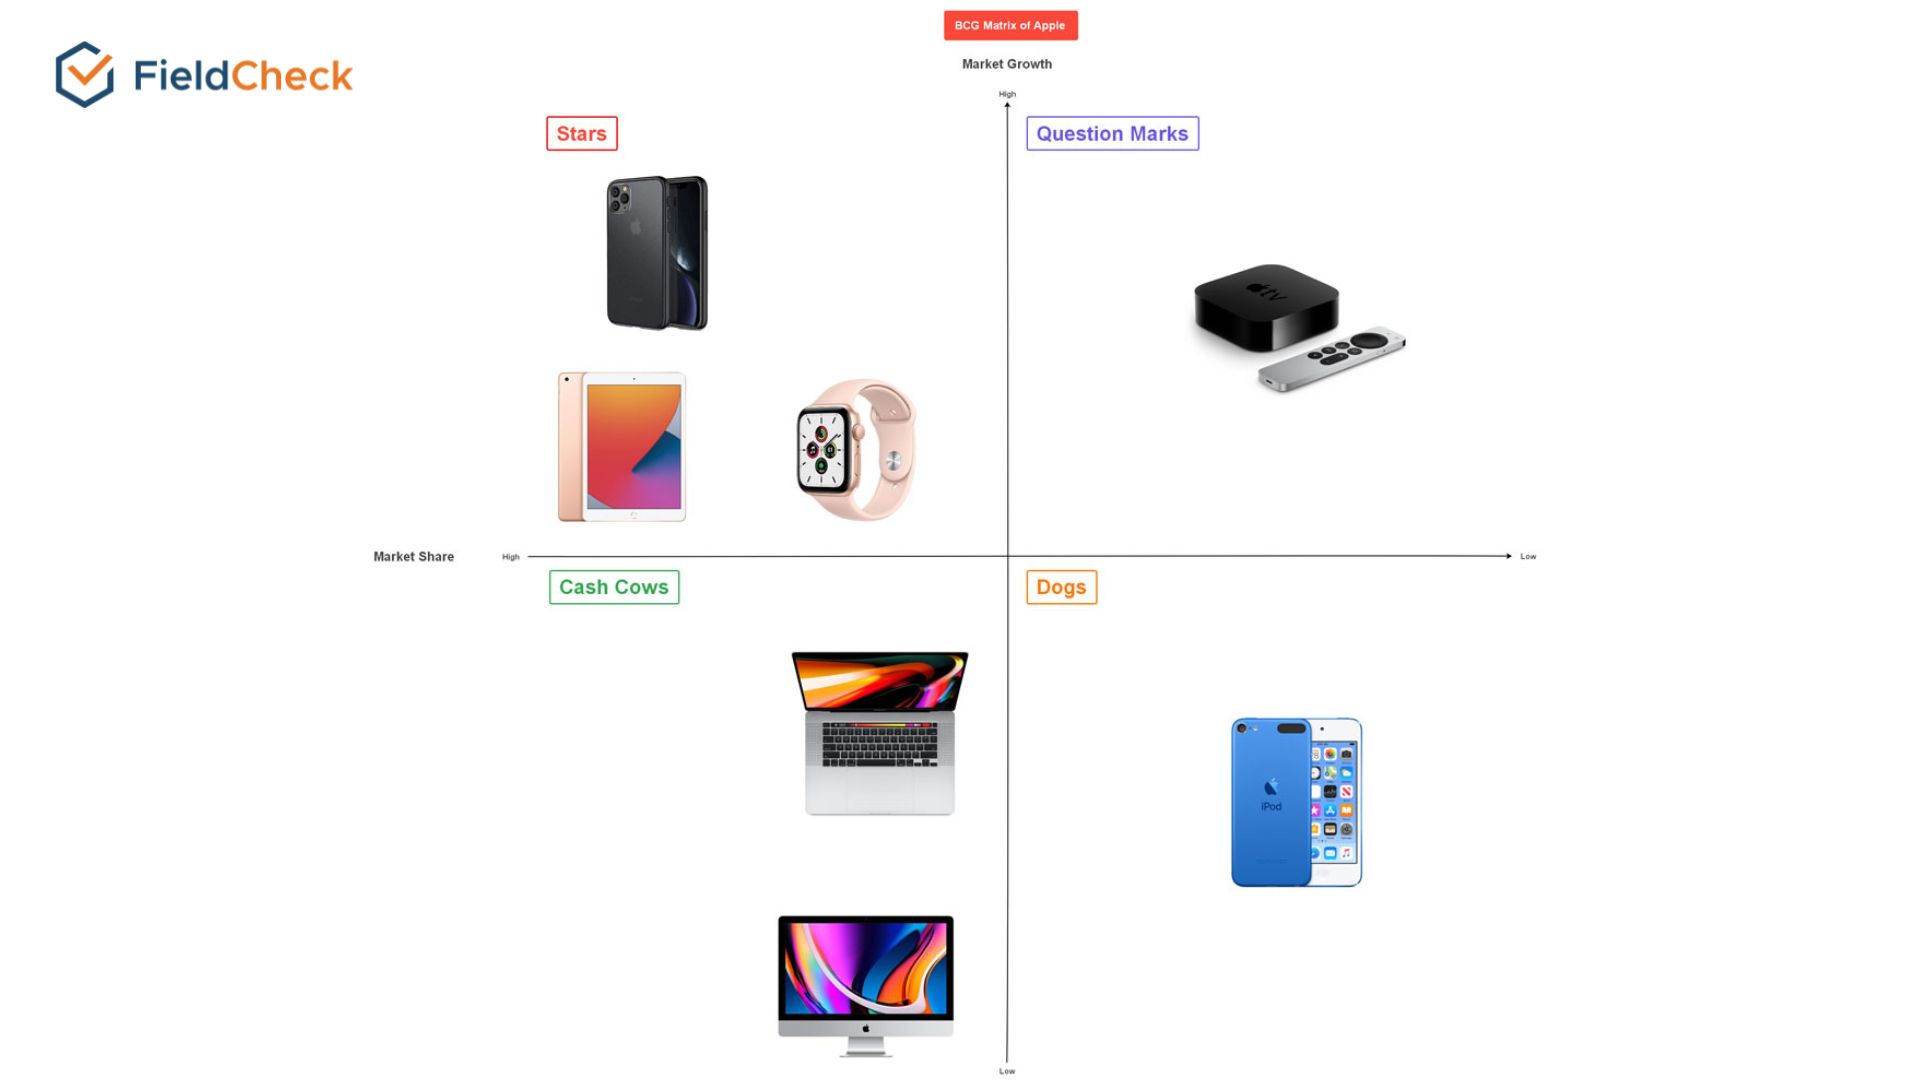 Apple BCG Matrix. (Image credit: edrawmind.com)
Cash Cow
Cash cow is a phrase that refers to products with a low growth rate but still holding a high market share.
In this category, the product already has a place in customers' hearts and creates a lot of profit value. Hence, businesses need to invest the necessary amount in maintaining the current competitive advantage and earning more passive money.
The SBU Cash cow provides the cash needed to turn the Question mark into a market leader, covering the company's administrative costs, research, and development funds, paying off the company's debts, and paying dividends, i.e., for shareholders.
Dog
If a business' products are placed in the Dog box, commonly known as the Dog or the Squid, they have slow industry growth and low market share.
Often these products do not bring high profits to the business and do not need to spend a lot of money to invest, leading to breakeven.
Therefore, companies should consider divesting or liquidating products in this category to allocate to other growth potential categories such as Question mark or Cash Cow.
The analysis and classification of the above factors in the BCG matrix help businesses identify the right product objects to invest in and develop their competitive strengths.
The matrix also helps businesses understand the life cycle of the product so that they can allocate and balance investment capital appropriately.
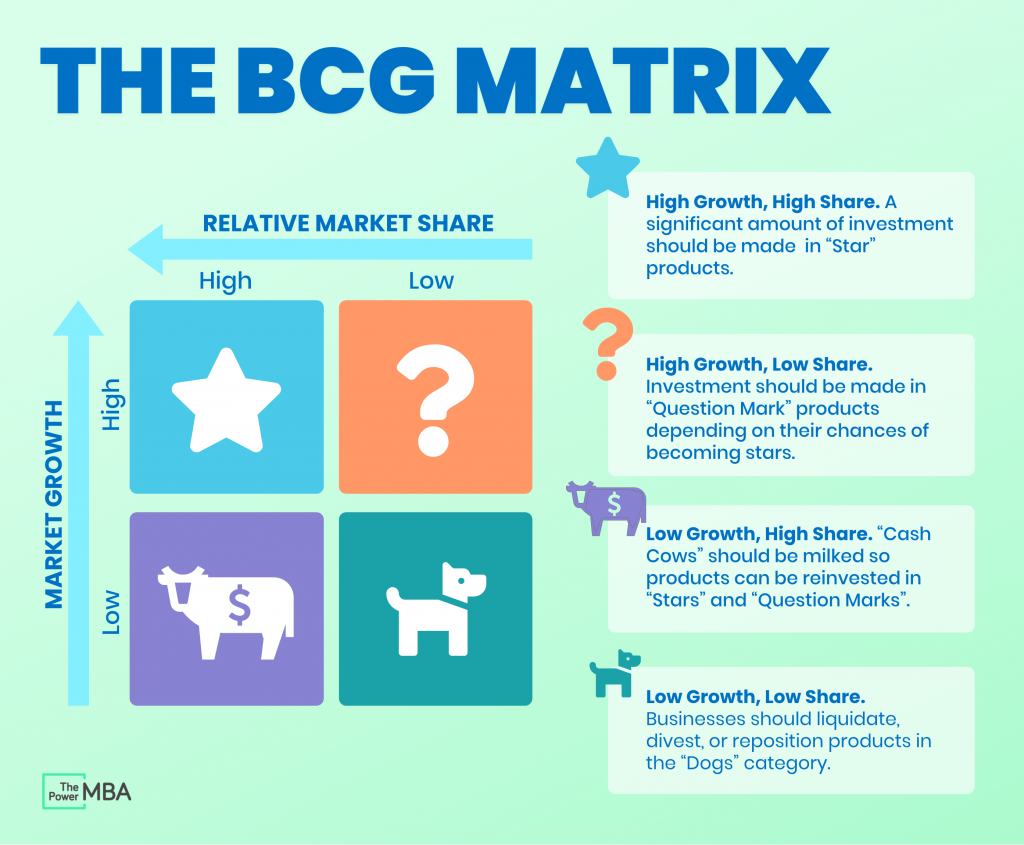
Based on the BCG matrix to come up with a reasonable investment strategy (Image credit: The Power MBA)
It can be seen that the BCG matrix has a close relationship with the product life cycle:
- The "question mark" group represents the product that is in the introduction phase, just launched into the market.
- The "Star" group is a product in the growth phase with steady revenue and growing market share.
- The group "Dairy cows" represents a product that is in the mature stage when sales hit the ceiling but the market started to slow down.
- The "Squid Dog" group represents a product that is in a period of decline in terms of revenue, market share and growth rate.
Advantages And Disadvantages Of BCG Matrix
Advantages
Simple And Easy to Apply
The first benefit of the Boston model is its ease of implementation and application. With a fairly simple analysis diagram, users do not need to have a degree or a high level of education. However, they can still understand and apply it to the business model with any product/service.
Looking at the BCG matrix, we can easily see that the Star and Cash cow groups are the two most profitable categories for a company dealing in products/services.
On the contrary, units appearing in two groups of Question Mark and Dog need special attention to avoid risks and failures for the company.
Easy To Identify and Eliminate Weak Products
Using the market share-growth matrix is an effective measure to help business managers identify areas and units with low efficiency to eliminate.
From there, save a lot of resources and investment capital for products with no potential, and focus on profitable trading products.
In other words, the BCG matrix is the way to help businesses allocate investment appropriately, thereby taking advantage of the budget to bring about high efficiency and maximize the business structure.
Companies can also use the BCG matrix in marketing and BCG matrix in strategic management for optimization of their operations.
See more: Kaizen Philosophy - Application To Improve Business Productivity
Easy To Identify and Invest In Potential Products
After identifying the categories to be eliminated, the company can focus on the products with a lot of potential for growth: the star portfolio and the dairy cows. Depending on financial potential and risk tolerance, managers can choose two directions.
Either the products have high growth potential in Star but at the same time require a significant investment of the company, or businesses can choose SBU Cash cow to help get good cash flow with minimal investment.
However, the growth rate of this group is not as potent as that of the star group.
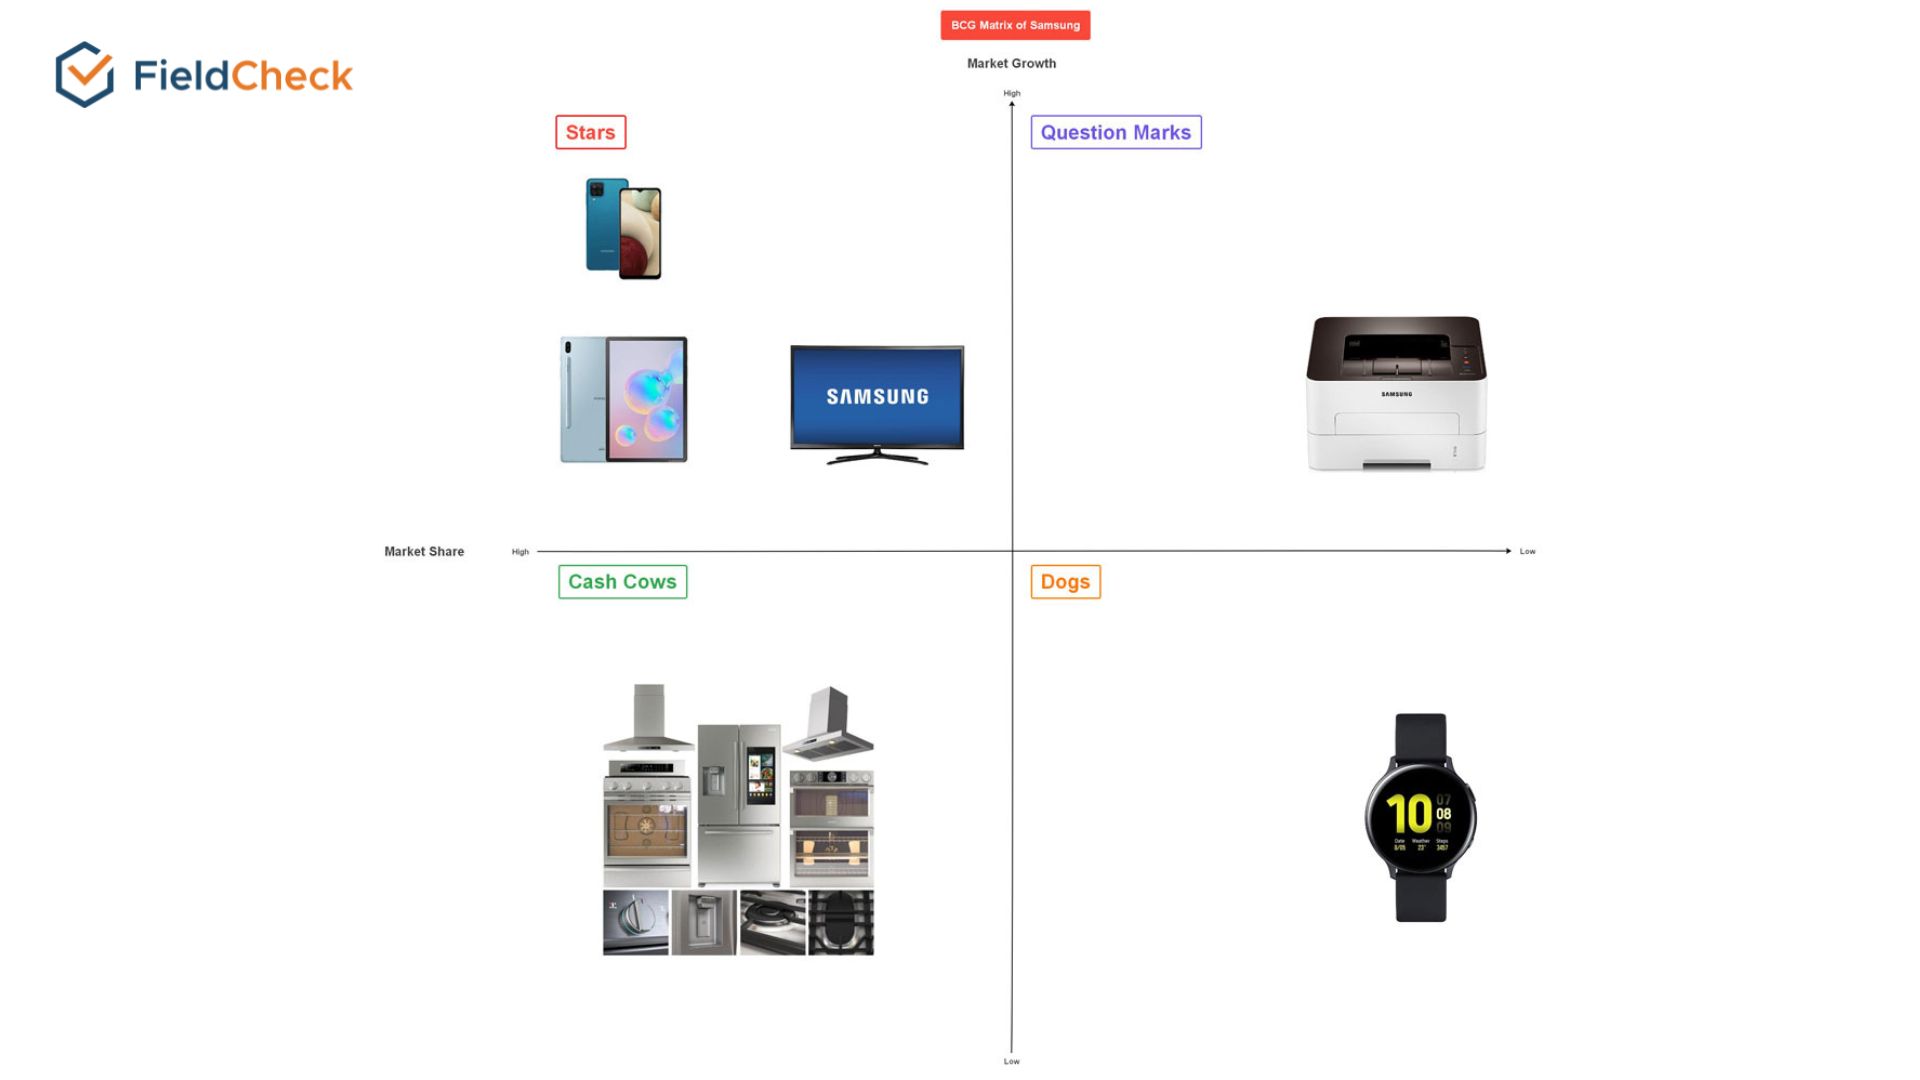 Samsung BCG matrix (Image credit: edrawmind.com)
Disadvantages
Not Taking Other Business Factors Into Account
A major limitation of the BCG matrix model is that it ignores other business aspects critical to success. Market share and industry growth are not the only factors of profitability. Besides, a high market share does not necessarily mean high profits.
Even if a company has chosen a line with the potential to generate money, the company will still lose money if poor senior leadership, unengaged employees, or unforeseen external causes arise.
Furthermore, choosing a product category in the Star or Cash Cow group does not guarantee that the company will always be profitable.
Not Suitable For Complex Business Models
In many complex situations, the BCG matrix will not have much effect because the approach to the problem is too simple. Because this model only considers three criteria: cash flow, growth rate, and market share, it is impossible to give an optimal solution for all cases.
In addition, only four quadrants were analyzed, and it is difficult to categorize a product if it falls between these categories.
Coca-Cola's BCG Matrix Analysis
Coca-Cola’s Background
The Coca-Cola Beverage Company is a well-known worldwide brand of carbonated soft drinks and a retailer and manufacturer of beverages based in the United States.
On May 8, 1886, Dr. John Pemberton introduced the Coca-Cola drink at Jacobs Pharmacy in downtown Atlanta. From humble beginnings, Coca-Cola has grown from a small company into a multinational corporation with a global reach.
The company has launched many product lines under the Coke brand name and distributed them in over 200 countries.
Thanks to product quality and a smart marketing strategy, the company has achieved sustained growth and become one of the market leaders in carbonated soft drinks in the 20th century.
Thus, the brand value and commercial level that Coca-Cola has is something that many businesses want to have.
Coca-Cola's BCG Matrix Analysis
- Star : Dasani, Kinley
- Question mark: Diet Coke, Minute Maid
- Cash Cow: Coke
- Dog: Coke
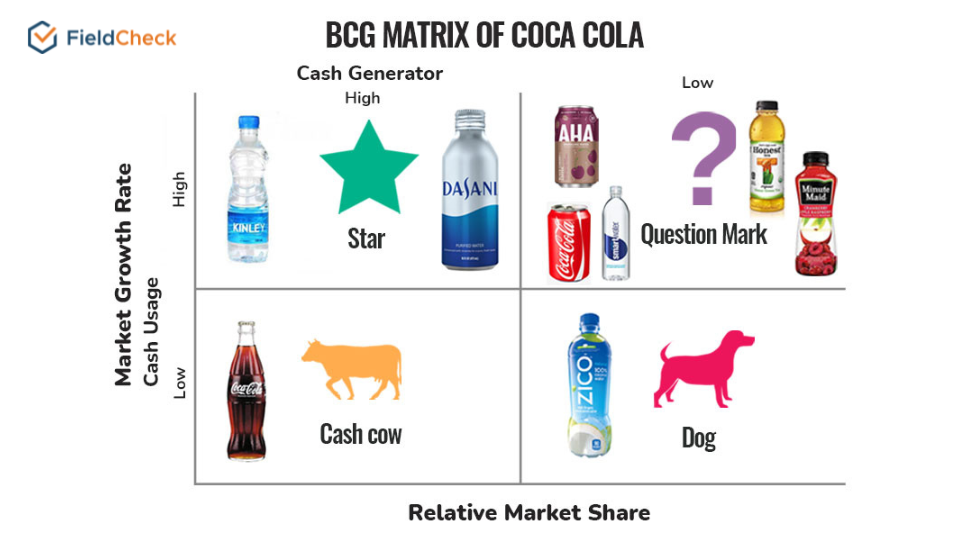
Coca-Cola BCG matrix
In Coca-Cola's BCG matrix example, Diet Coke and Minute Maid are Question Mark products, as these products appeal to a modest audience but still have room for growth.
Bottled water brands Kinley and Dasani are Stars because they dominate the market in Europe and the US and show no signs of slowing down.
Meanwhile, the traditional Coca-cola is Cash Cow because it has a low growth rate and high market share. However, demand for carbonated soft drinks is declining, fueling a growing demand for healthier options or low-calorie drinks like Diet Coke.
If these factors continue to increase, this iconic drink will also likely become a low market share product and the Dog category.
How To Set Up The BCG Matrix
To set up a BCG matrix, you first need to determine the two most important parameters: the business's relative market share and the industry growth rate.
For example, relative market share equals unit sales divided by competitor sales. If the result is 0.1-1, then SBU has a low market share. Conversely, if the result exceeds 1, the SBU has a high market share.
After having the results of the two parameters of market share and market growth, we will determine the business's SBUs.
Each business unit/product is a quadrant on the BCG plane, whose magnitude is proportional to the SBU's contribution to the business's total revenue. Next, we will, in turn, include the SBUs in the BCG model.
Representation of SBUs on the BCG model: determine the position of the BCGs on the matrix through two factors: the relative market share of the SBU and the growth rate.