Gantt Chart: An Effective Project Management Method
Gantt Chart is one of the data visualization charts used to manage various projects. This chart was developed based on the Polish engineer's idea of a visual workflow diagram more than 100 years ago.
But so far, it is still a useful tool in planning and helping users improve how to manage work effectively. So do you know what a Gantt chart is and how to draw and use it?
Let's find out with FieldCheck the answer in the article below!
The article also points out the advantages and disadvantages of this tool so that you can refer to and decide to use it properly.
Gantt chart
What Is a Gantt Chart?
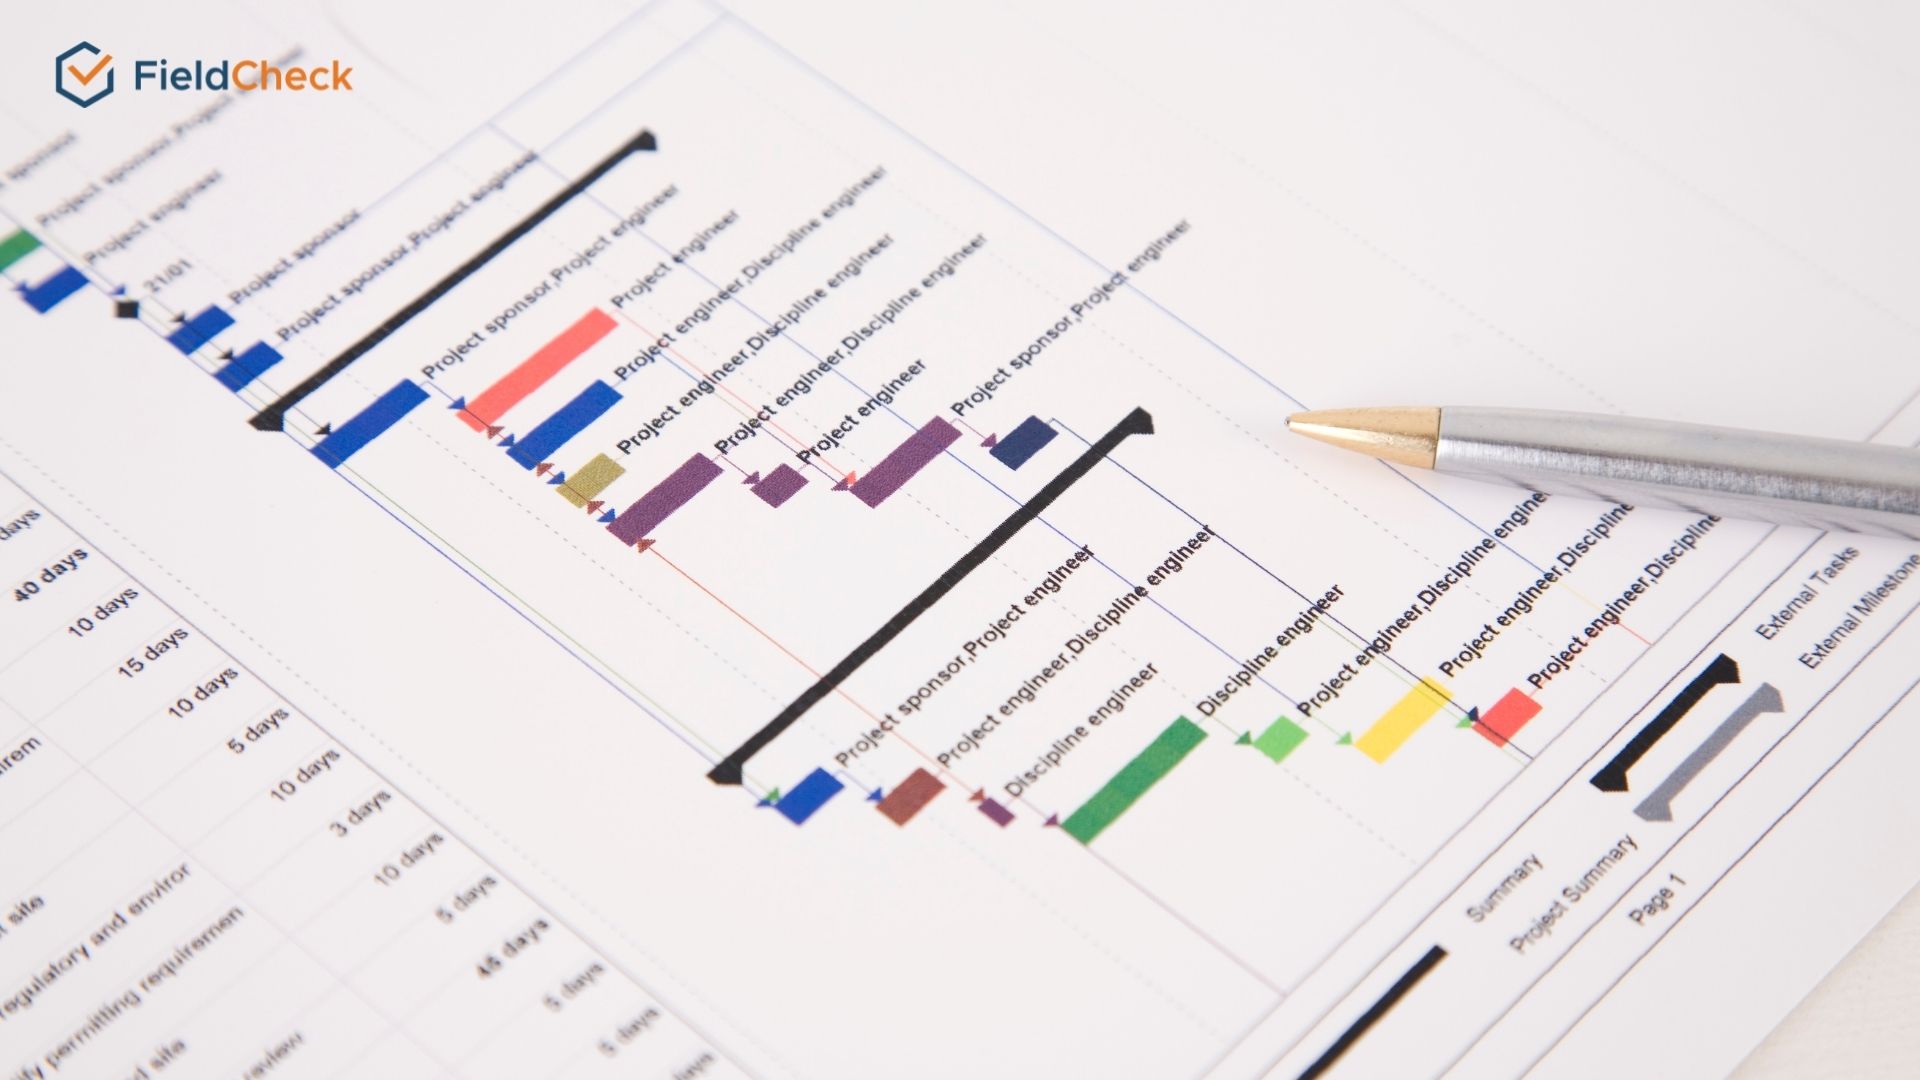
A Gantt chart is also known as a Gantt horizontal chart. It is used to generalize the name of a professional project management tool with two main components: the vertical axis represents the job name, and the horizontal axis shows the timelines for those tasks.
Looking at a Gantt chart, you can easily capture the necessary information for each task and the timeline of the whole project. Because of its clear, easy-to-understand information layout, Gantt charts have become a favorite tool for many people in project management.
The process of planning, scheduling, and controlling the progress of projects becomes a lot simpler with the help of the Gantt Chart.
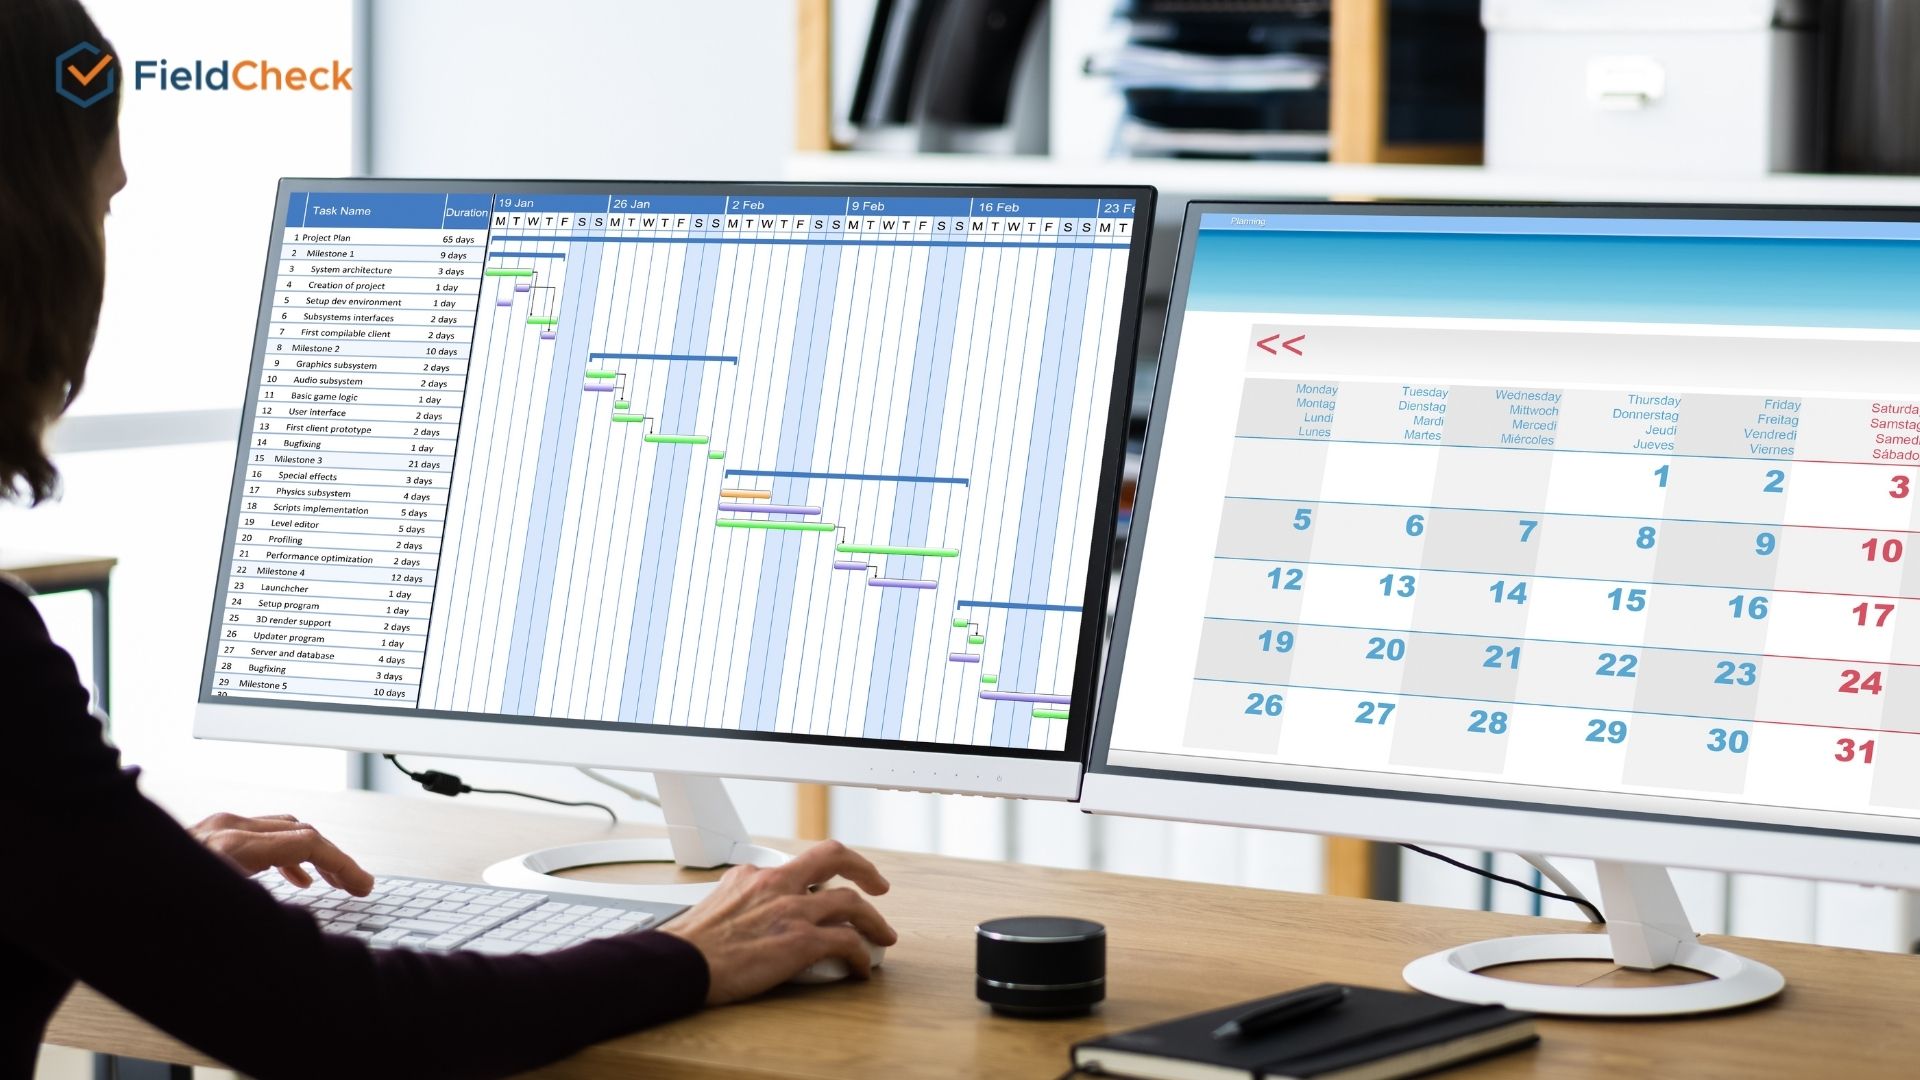 Gantt charts make easier project management
The History of Gantt Charts
In this section, let's find out why the Gantt chart got its name and where this clever tool came from.
According to Wikipedia, the Gantt chart is named after the person who designed and made it available to the public, Henry Gantt.
Karol Adamiecki, a Polish engineer, in 1896, first developed this tool. However, he called it a harmonogram and published it only in Russian and Polish, thus limiting his recognition of authorship.
Around 1910-1915, Henry Gantt developed Adamiecki's idea and designed it to be a visual project-tracking tool to measure employee productivity, to assess whether workers are underperforming and which workers are over-productive.
And that is the basis of the Gantt chart we use today.
Gantt chart is a tool that has been developed for a long time and is still useful today
The first Gantt charts were drawn on paper; any adjustments or changes to the schedule required a full redraw. Years later, project managers used pieces of paper or building blocks that made up Gantt bars so they could be edited as needed.
With the advent of the Internet and increased use of technology, by 2012, people created most Gantt charts with software to adjust as schedules changed easily.
And so far, the Gantt chart is still considered one of the most widely used management tools for project control despite the appearance of many other management tools such as Flowchart, Kanban, etc.
What Is A Gantt Chart Used For?
A Gantt chart is a modified horizontal chart to illustrate the timeline of phases in a project. It overviews how activities and tasks are linked and where they are in the overall project progress.
Specifically, this tool will promote its usefulness and effectively support businesses in cases such as:
1. To plan a project with clear timeline
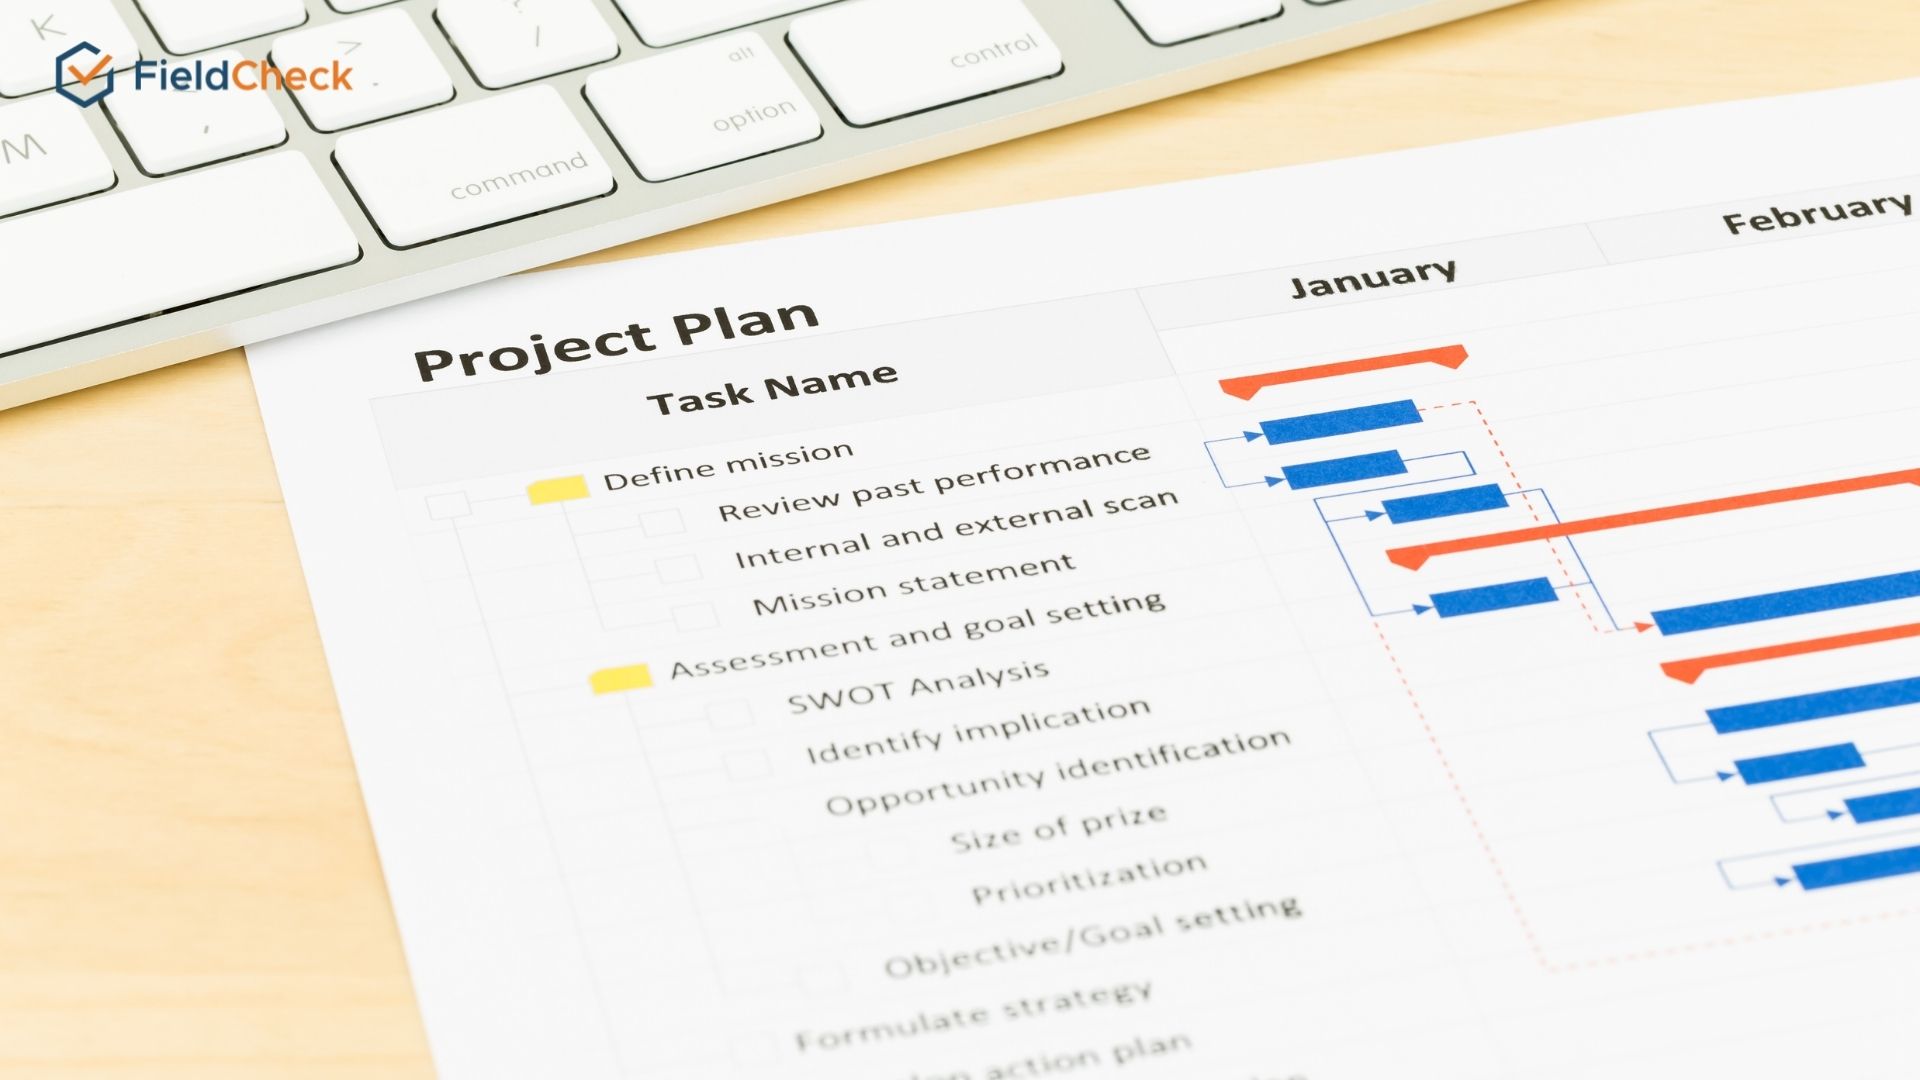
Project planning is the main function of the Gantt chart. This tool does a great job of showing a list of tasks so the manager can more clearly build the timelines and ensure the completion of the project.
Project planning is the main function of the Gantt chart
2. Assign and allocate tasks for employees
The Gantt chart allows its users to visualize the tasks at a particular time and the transition period for the work to the next person. Gantt also tells you how much time and personnel you will need to complete the project.
From there, the project manager will arrange and assign tasks to his employees in a more reasonable way.
3. Summarize schedule
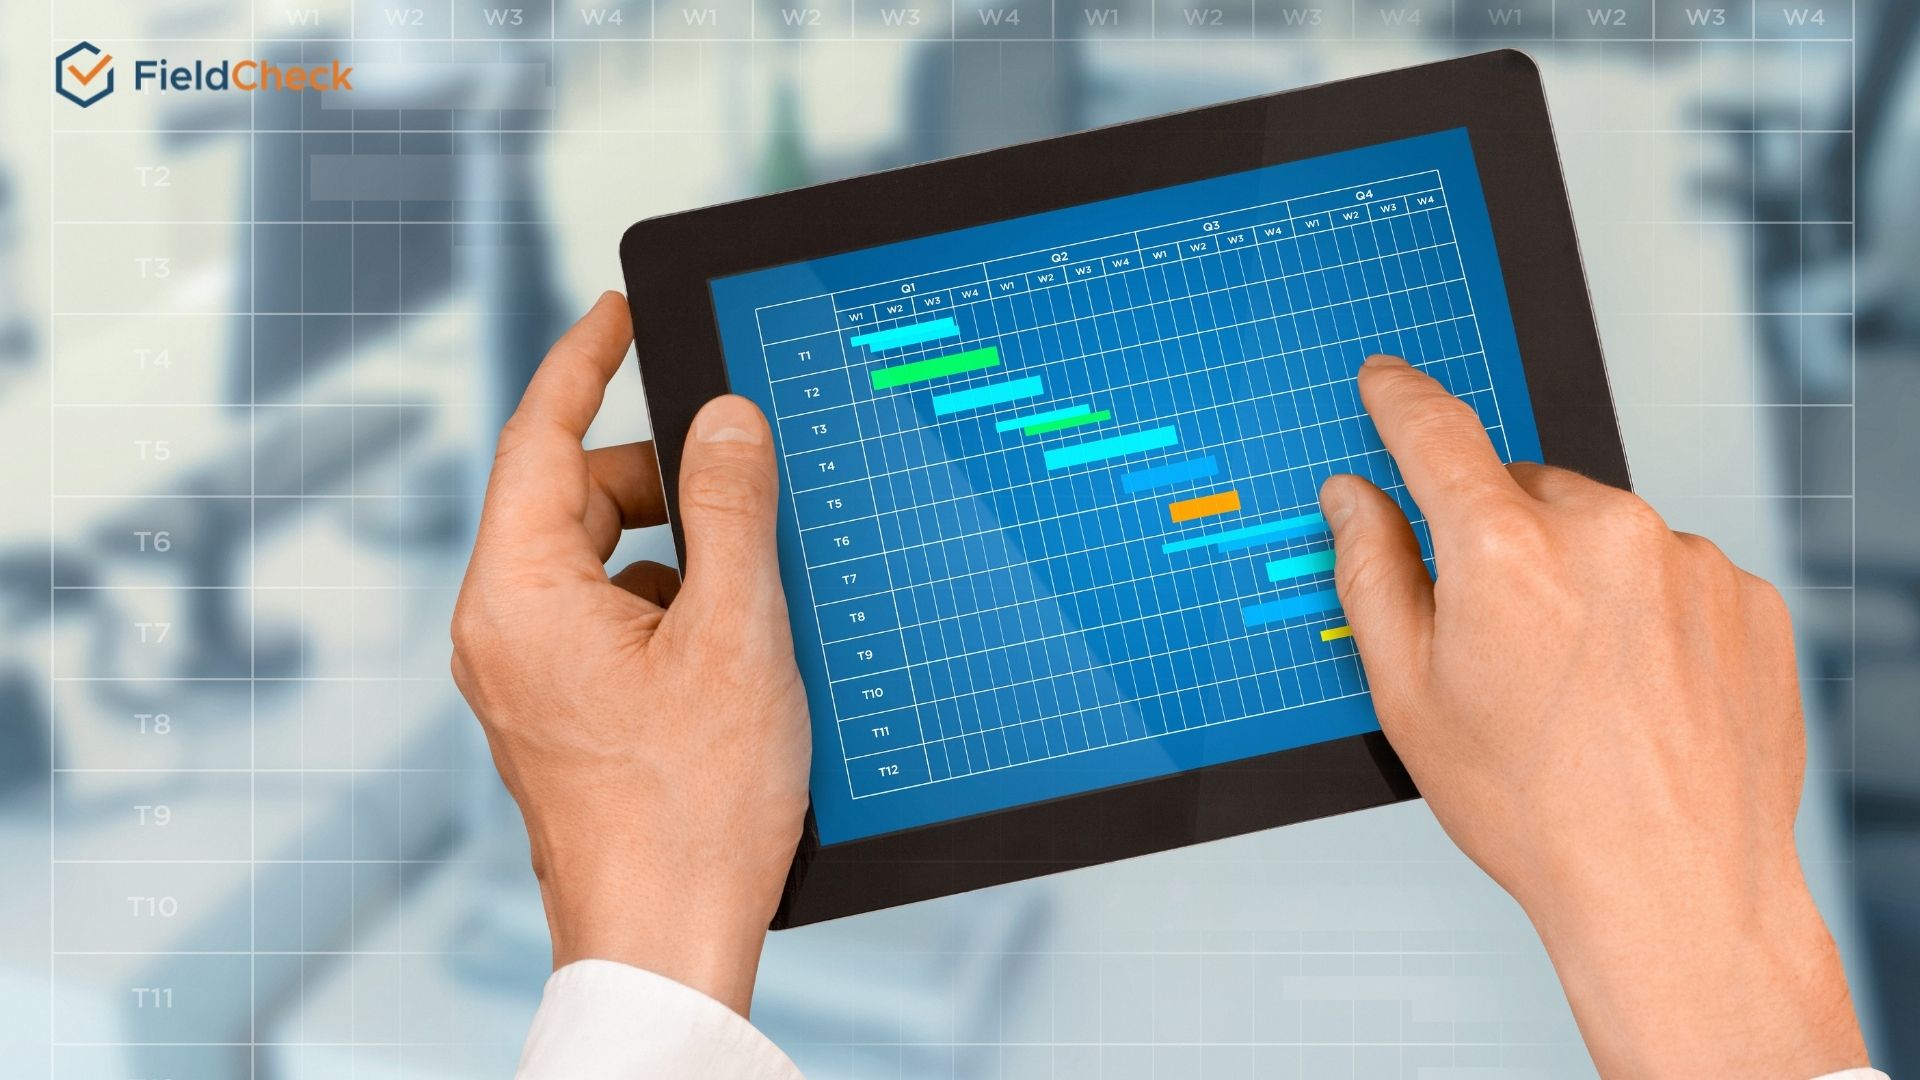
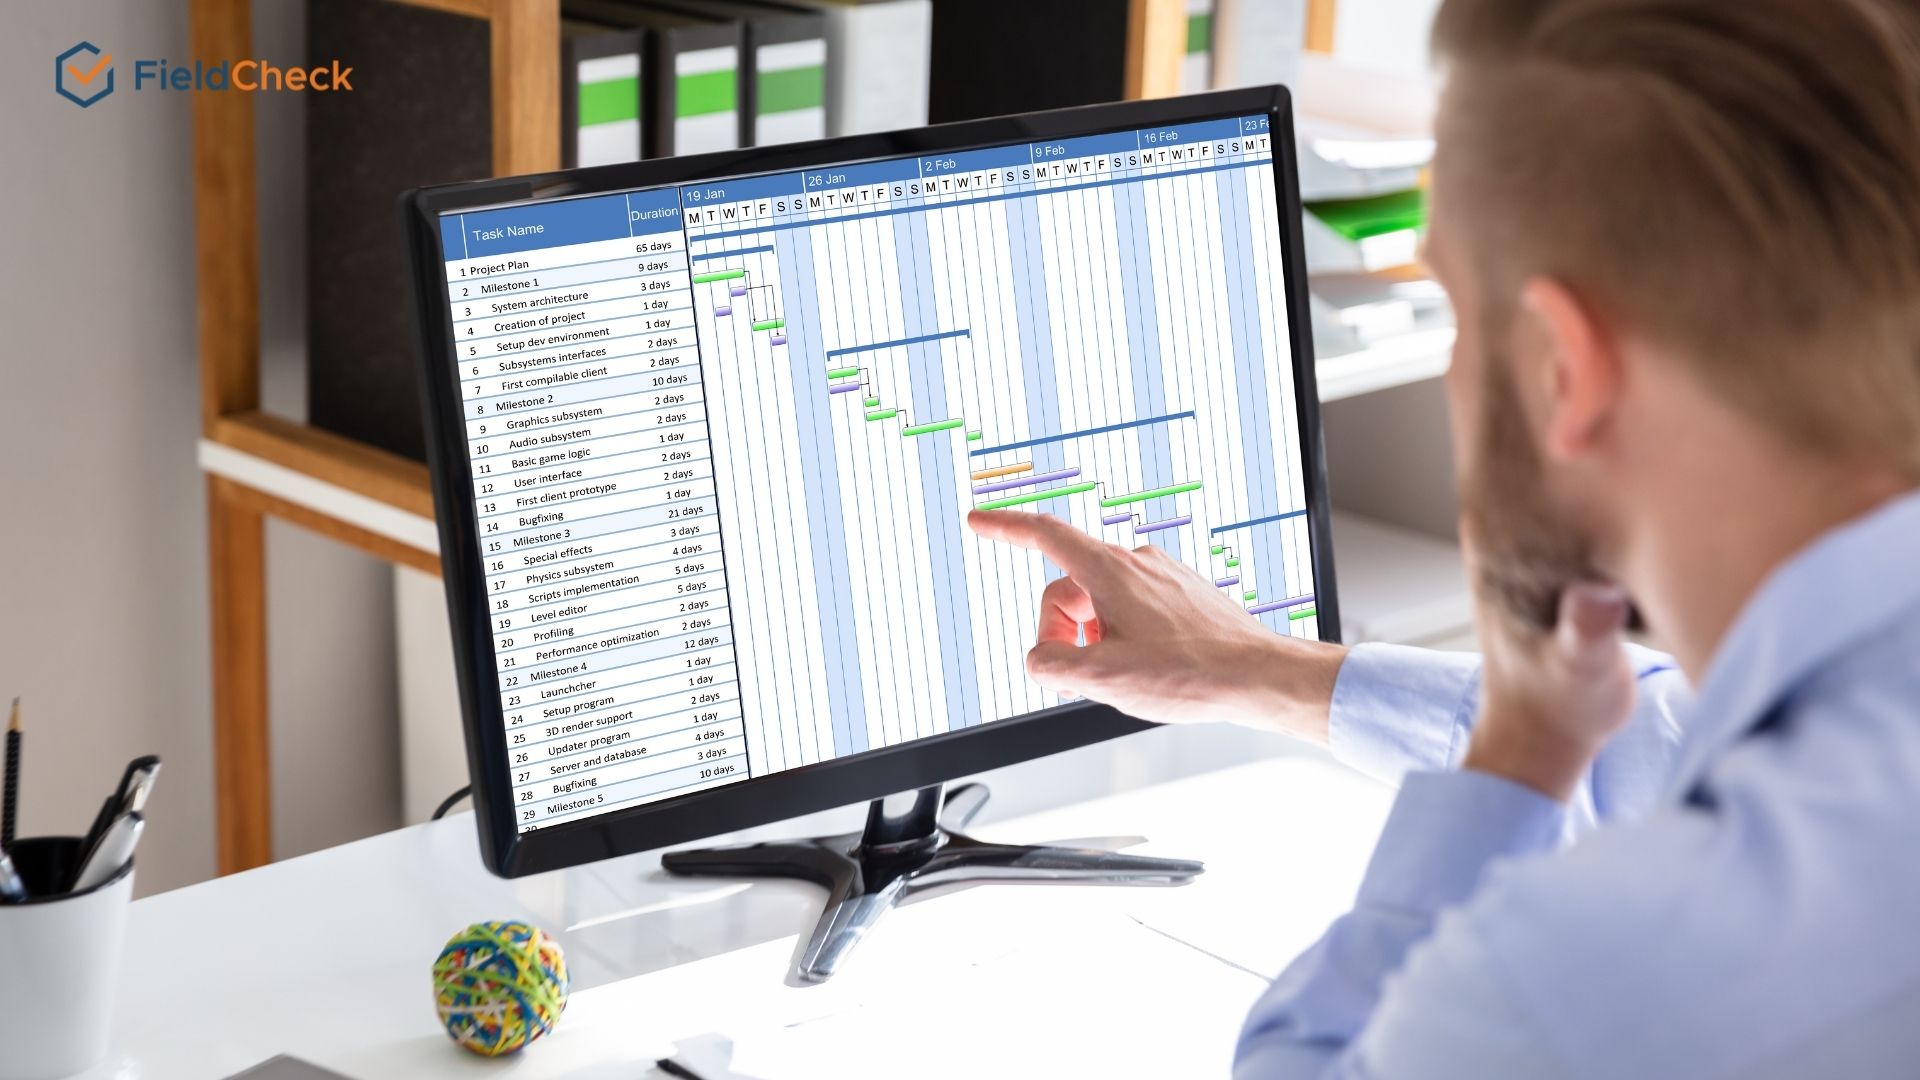
With the ability to present information visually, this tool also helps you to have an overview of the project schedule in the form of a summary. You can send this diagram to your employees and partners so they can both stay on top of the agenda and track the project's progress.

Gantt chart gives a visual overview of projects
Advantages That Make Gantt Charts So Popular
One of the reasons Gantt charts are so popular is that they are ideal and suitable for project planning for simple types of work with little overlap.
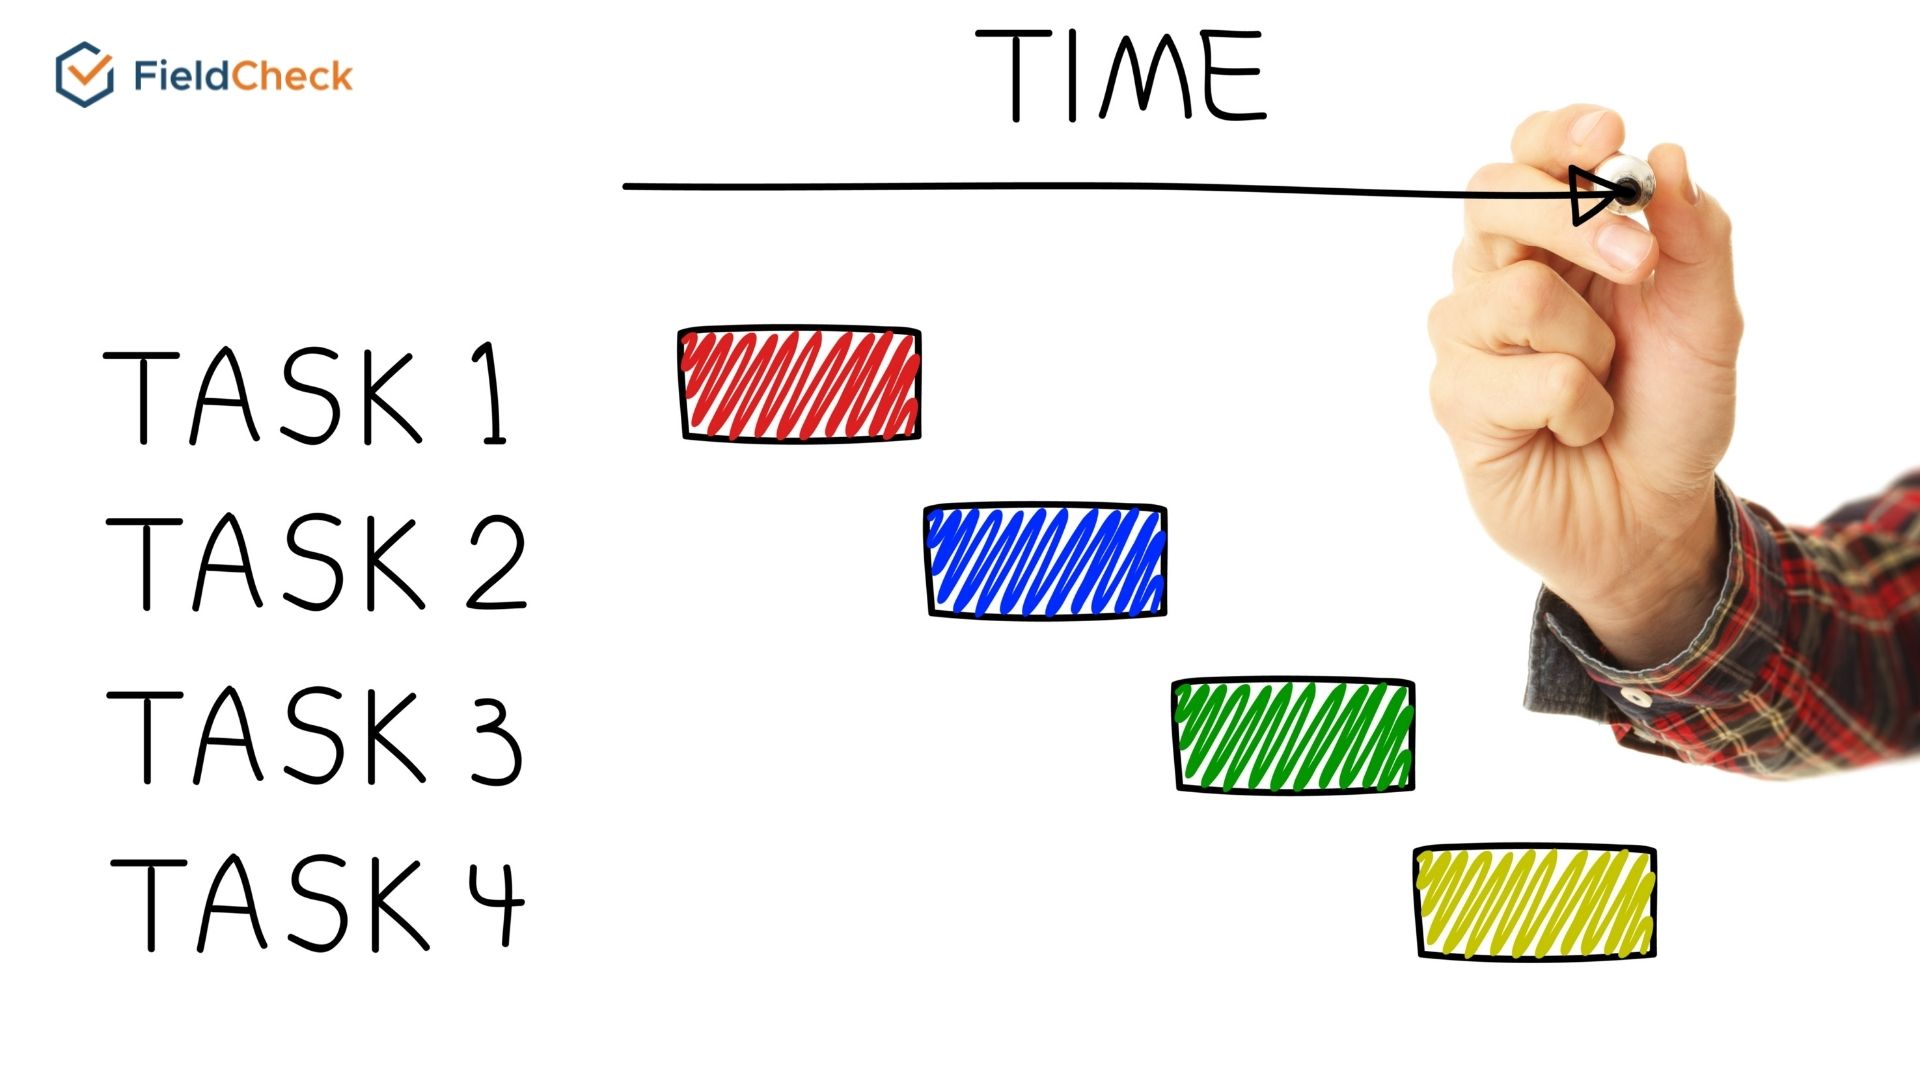
Not only that, Gantt diagrams are easy to draw and read, making it easy for viewers to distinguish between work and task time. They can also see the total time to complete the tasks in the project.
In addition, Gantt charts also have many outstanding advantages compared to other types of tools.
- Capture essential information quickly and clearly
- Manage multiple data at the same time
- Control task time more effectively
- Limiting delays in the implementation process
- Helping individuals take the initiative in completing tasks
- Promote teamwork and increase productivity
- Limit work overload
- Using human resources effectively, ensuring the quality of the project
Gantt charts are the ideal tool for planning simple projects
Disadvantages of Gantt Charts
Besides the above strengths, the Gantt chart still has some limitations, such as:
- Only good at simple projects and tasks
- Difficult to perform on 1 page for complex projects
- Needs regular updates to reflect the reality of the project
- Depending on the divided structure, it will take time to redo the entire diagram if there is an error or unexpected change.
- It does not represent the basic constraints of a project: cost and scope
- Lack of prioritization for each task/work

Complicated projects are often difficult to represent with Gantt charts
Steps For Gantt Charting
Traditional Gantt diagrams are created by hand drawing on paper, which is quite inconvenient for those who are not good at presenting and laborious to redraw many times each time they need to change information.
Today, you can use spreadsheets in Microsoft Excel or Google Sheets and some online software to create Gantt charts for free. But no matter what medium you use, you must follow these basic steps to create an effective Gantt chart.
Step 1: List important job items
The first thing you need to do before building a Gantt chart is to create a list of all the tasks that will be performed in the project. In addition, you also need to define the goals that the project needs to achieve.
Once you have a list of required work items, estimate each task's time and human resources to start the project.
Step 2: Determine the relationship between tasks
Next, determine which work needs to be done first before another can be done, and make sure it happens in the right order. These dependent operations are called "sequential" jobs.
Other tasks will be classified as “parallel” tasks – meaning they can be done at the same time as other tasks. The more parallel jobs, the shorter your project schedule.
Defining "sequential" and "parallel" tasks gives you a deeper grasp of how to organize a project and helps when starting to depict a schedule of activities on a chart.
List tasks and missions - identify their relationship
Step 3: Start to create the Gantt horizontal chart
So you have the data you need to draw a diagram for your project. You can sketch on paper using Excel or professional Gantt chart drawing software.
Many tools to support project management, by the Gantt chart, have been designed based on cloud computing.
You and your team can access the software to view or edit the figures on the chart from any location, which will greatly help you when discussing, optimizing, and reporting projects.
Step 4: Update project progress
After implementing and creating a complete Gantt chart, managers must regularly monitor and update changes to keep the project finished and on track to achieve high productivity. Because during the implementation of the project, there may be things that need to be modified.
Therefore, you need to monitor and update the changes to make timely adjustments regularly.
Keep track and update Gantt chart regularly
Detailed Instructions on How to Draw a Gantt Chart Using Google Sheet
Although Microsoft Excel is a popular and easy-to-use software for many people, the creator has to take the extra step of saving it on the computer and uploading it to the cloud for storage. It might cause you inconvenience when you create a Gantt Chart in Excel. Not to mention that you might lose all data if there is a power failure or computer error while creating the chart.
Using Google Sheets to draw a Gantt chart is convenient for storing data online and easy to do in just a few very simple steps. Instructions on how to draw Gantt project management diagrams in Google Sheets are as follows:
Step 1: Open a new blank sheet
Search Google Sheets on a web browser that supports the free Google suite of apps. Click on the blank page in the Start a new spreadsheet section to create a new blank spreadsheet.
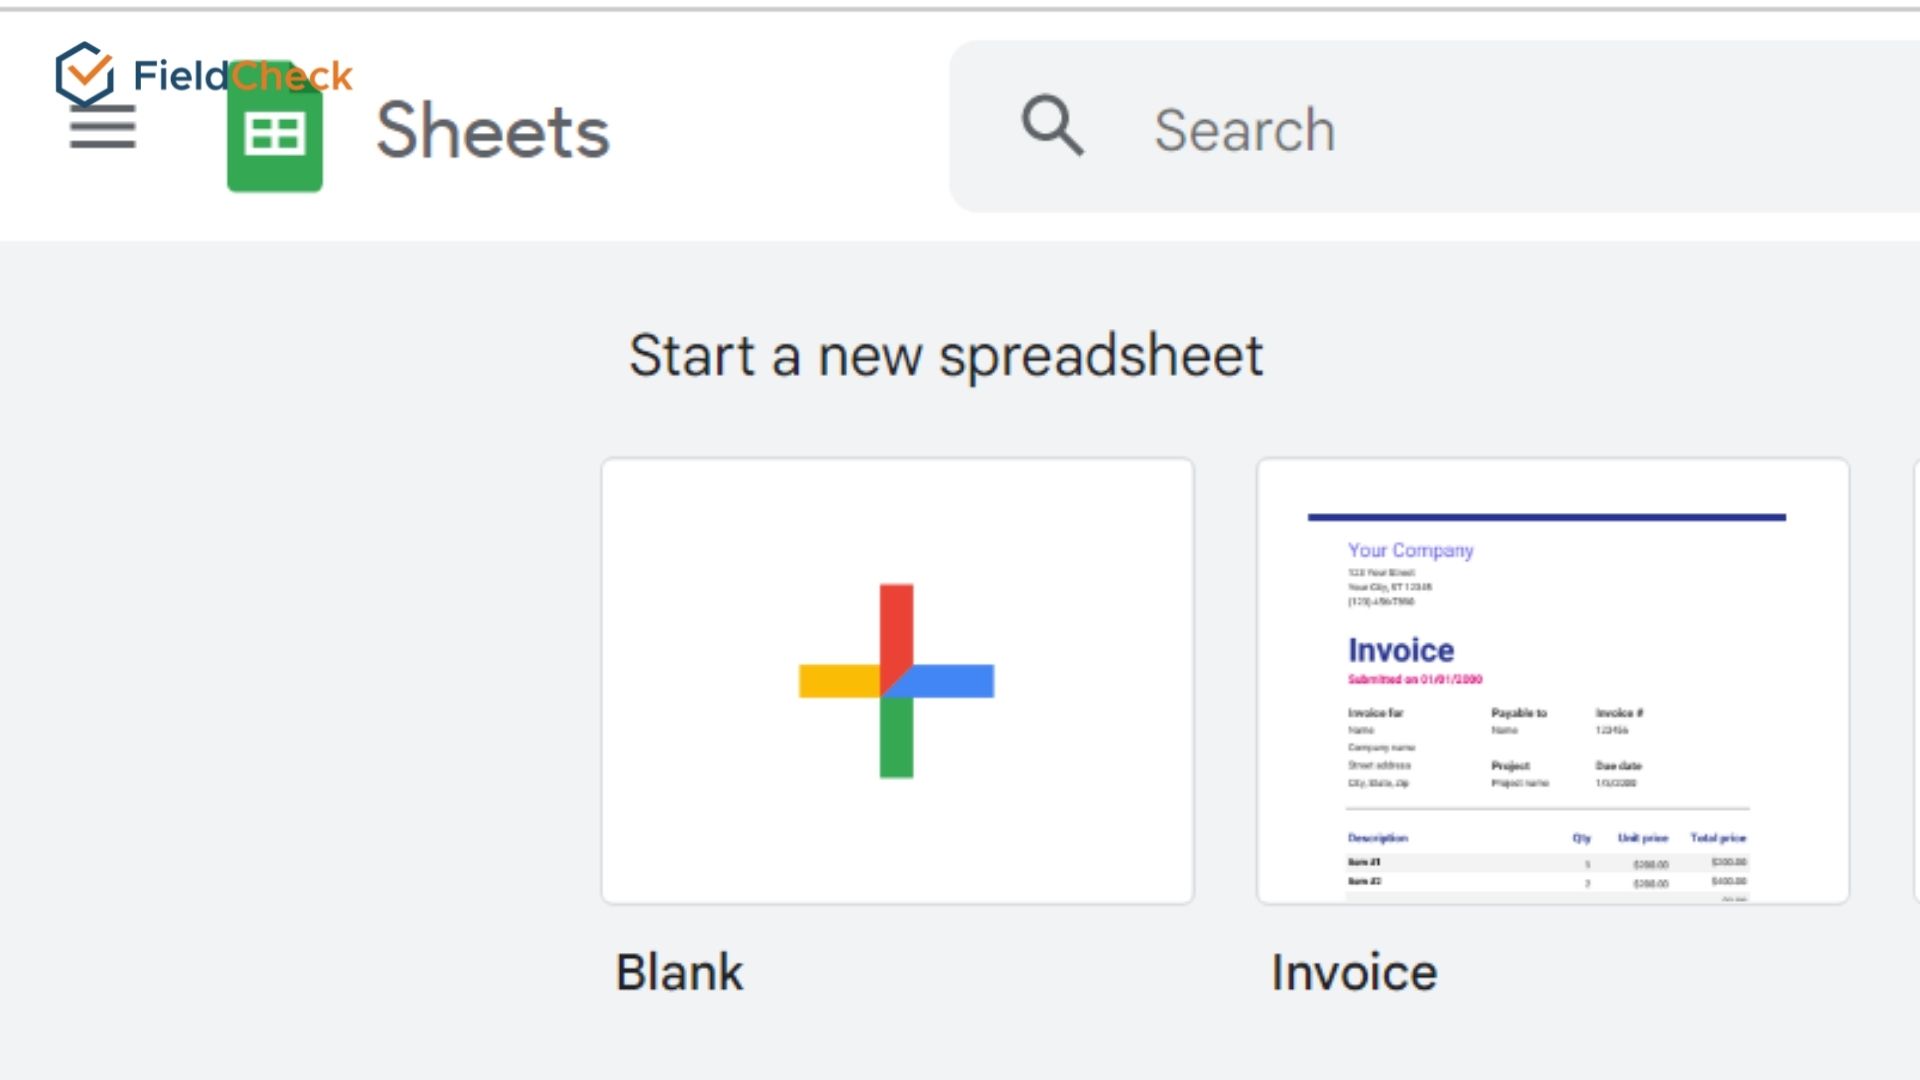 Click the plus symbol to create a new sheet
Step 2: Enter your project's information
In the new workbook, create a table with the available information by entering the task name, start date, and end date in the cells horizontally. These tasks will be listed in the order in which they occur.
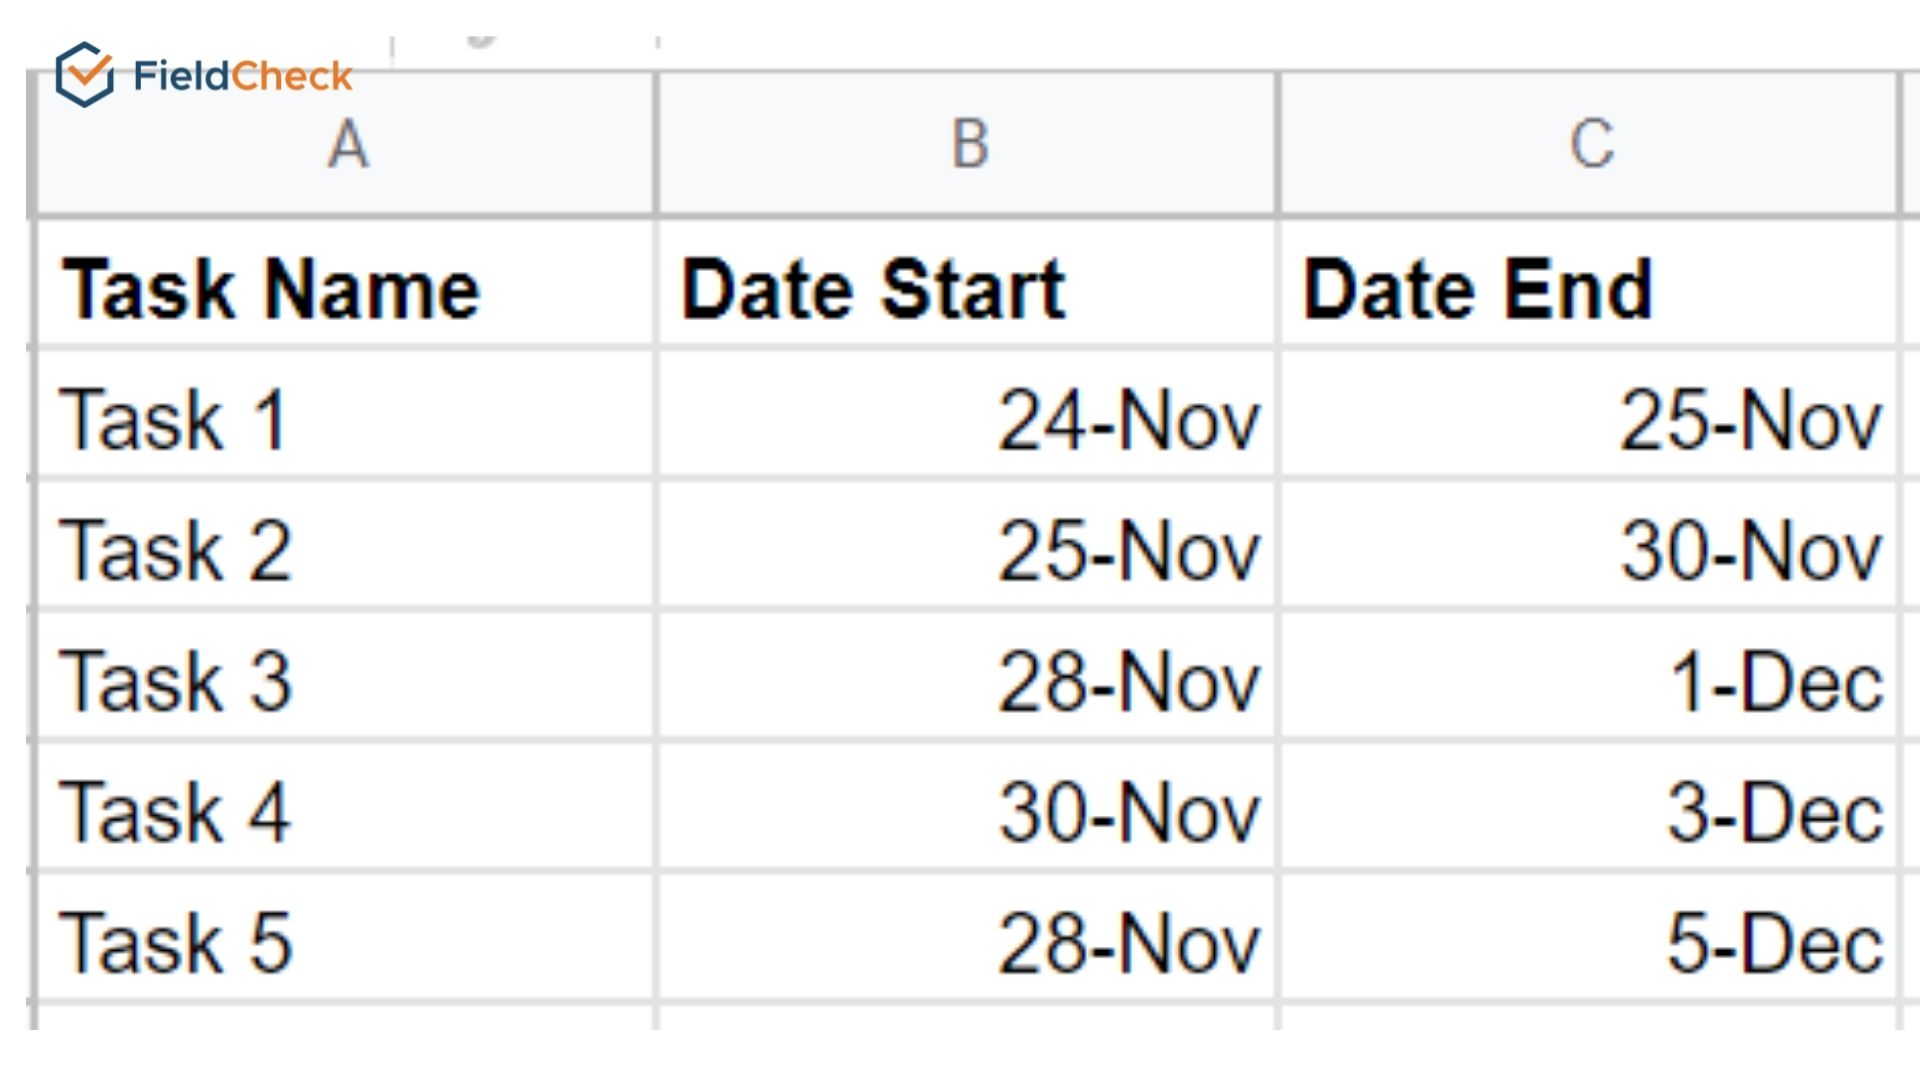
Create a table with columns Task, Date Start, Date End
In addition, Gantt charting still requires completion time data, which is the actual number of days it takes to complete each task.
Use the INT function to enter the formula to calculate the number of days to complete the task with the calculation: "Duration of work = End date - Start date."
From here, we have a second table with the data of the Start Date and the completion time.
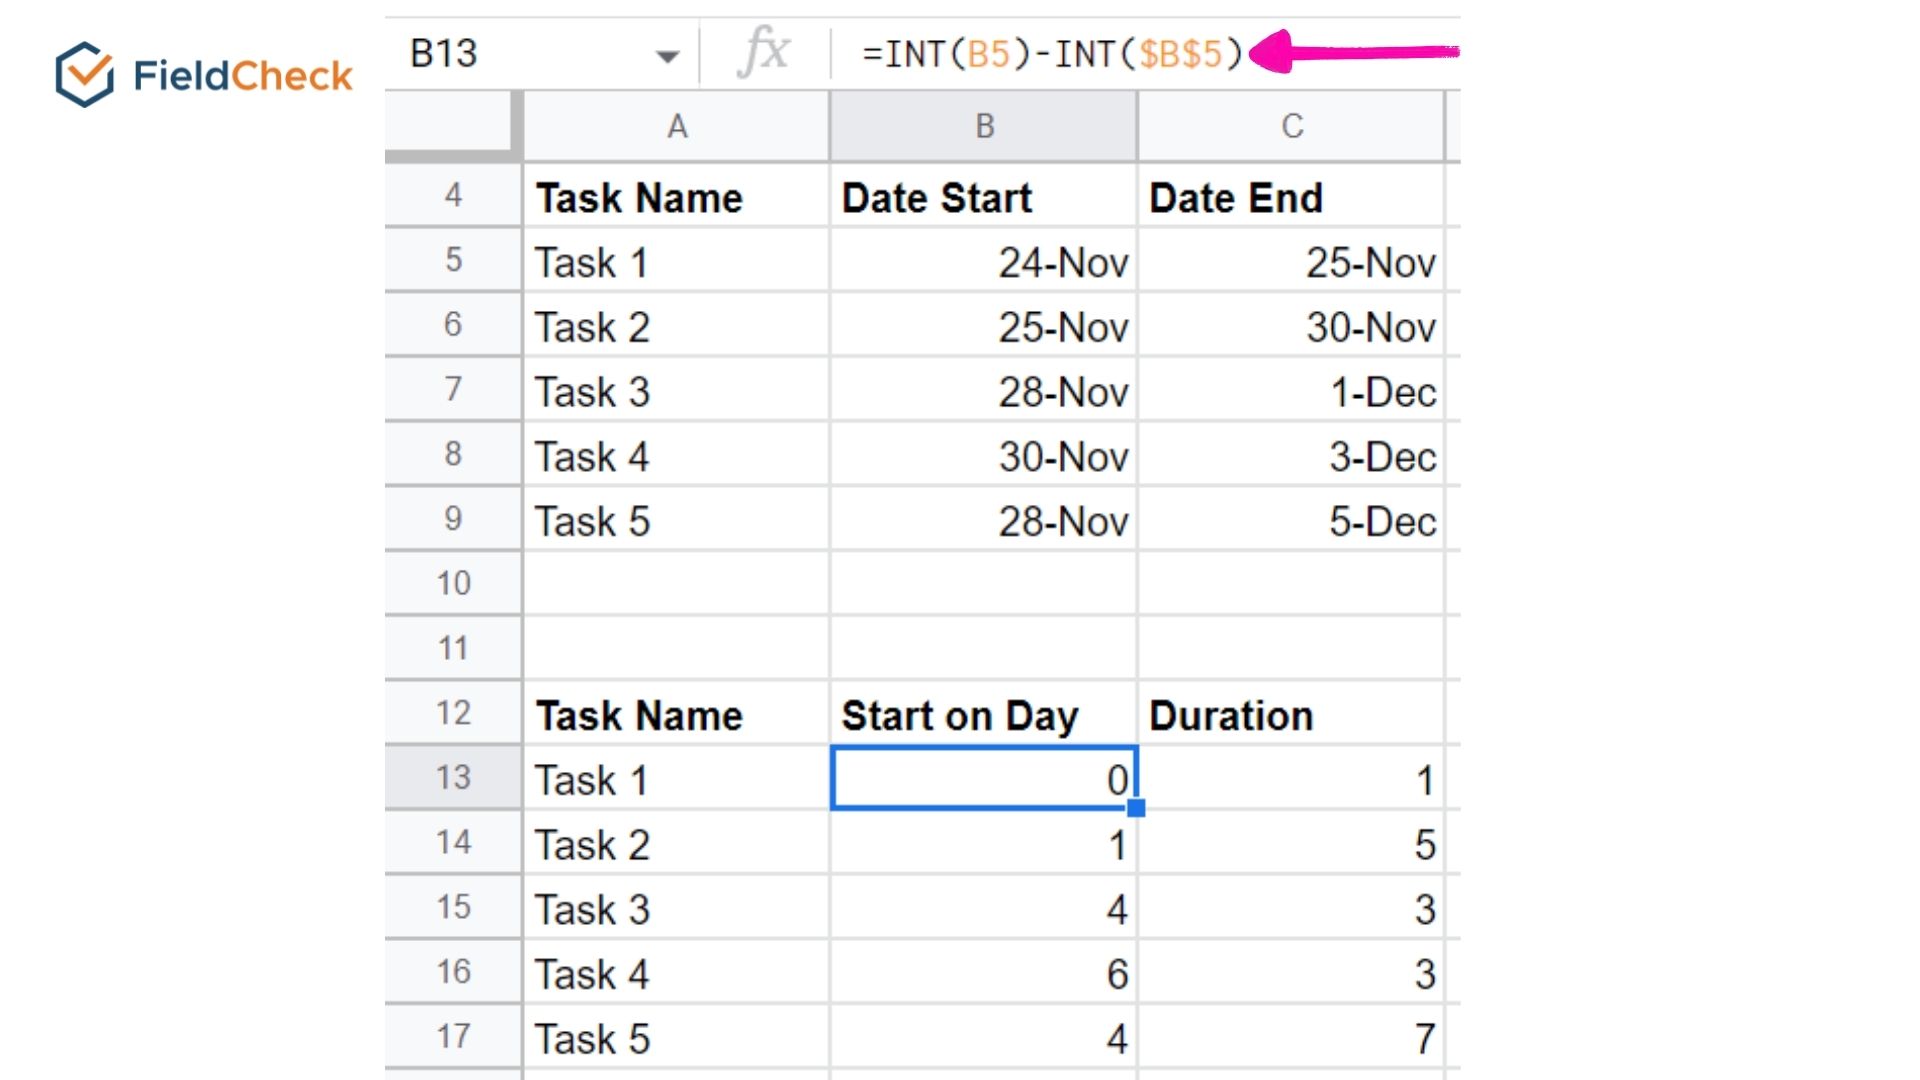
Create a second table
Step 3: Insert a stacked bar chart
Highlight the 2nd panel, go to the "Insert" tab, and click "Chart"
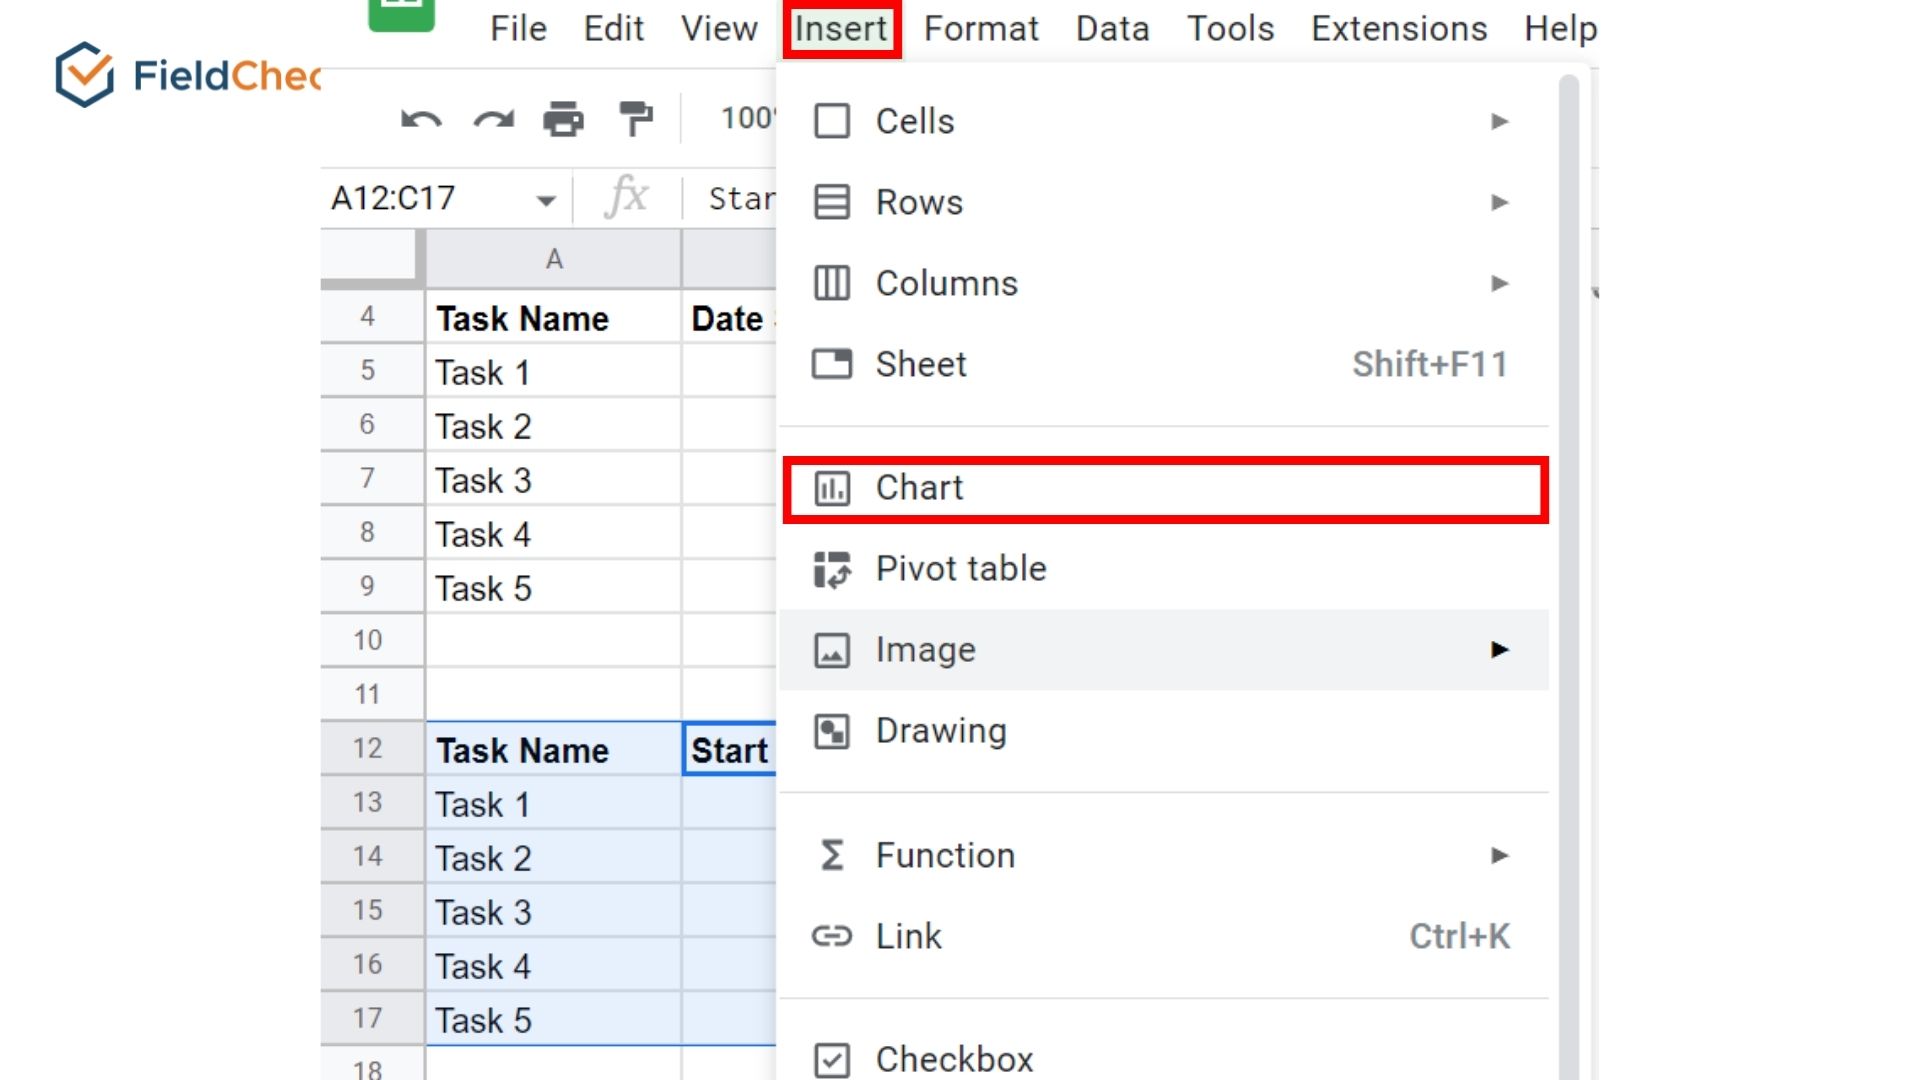
You will see a stacked bar chart appear, and the chart edit box is displayed on the right-hand side.
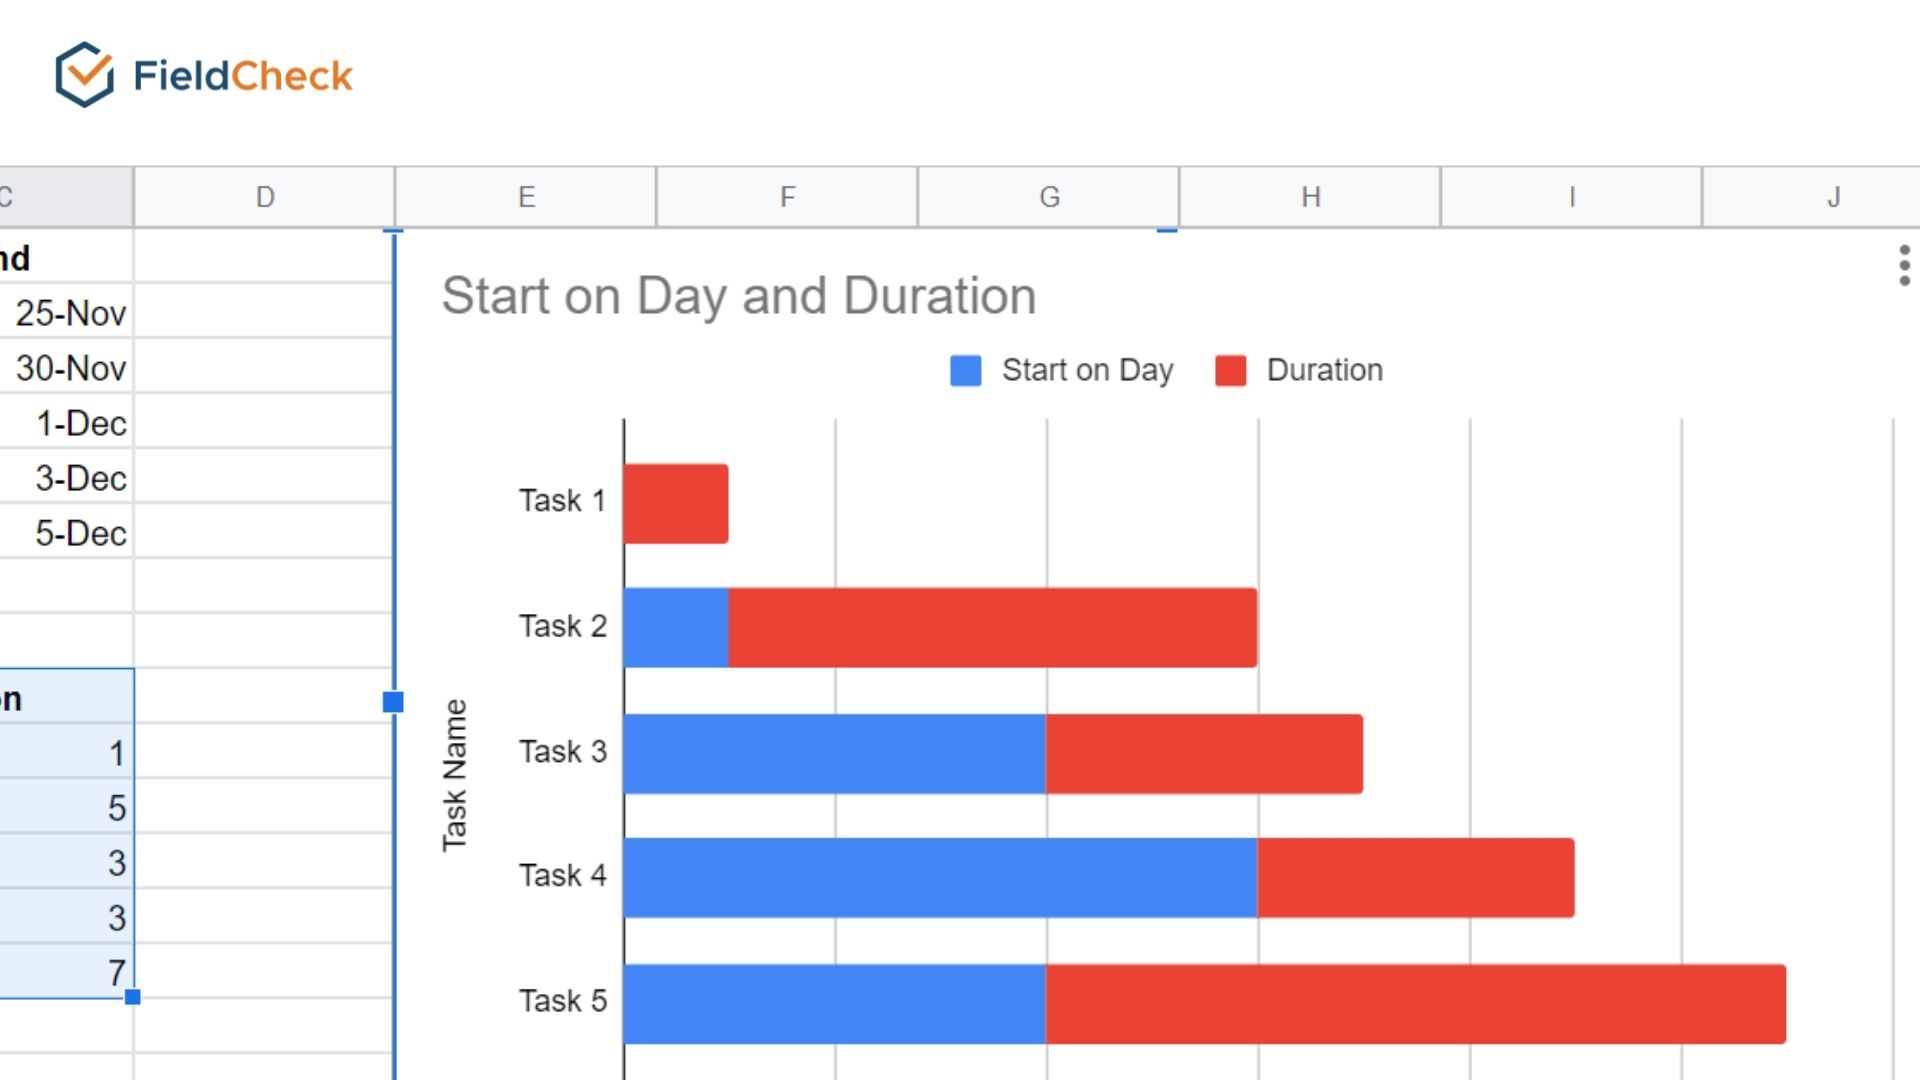
Step 4: Convert the bar chart to a Gantt chart
Go to the Customize tab on the chart edit box by double click. Then press "Series" and select "Start Date".
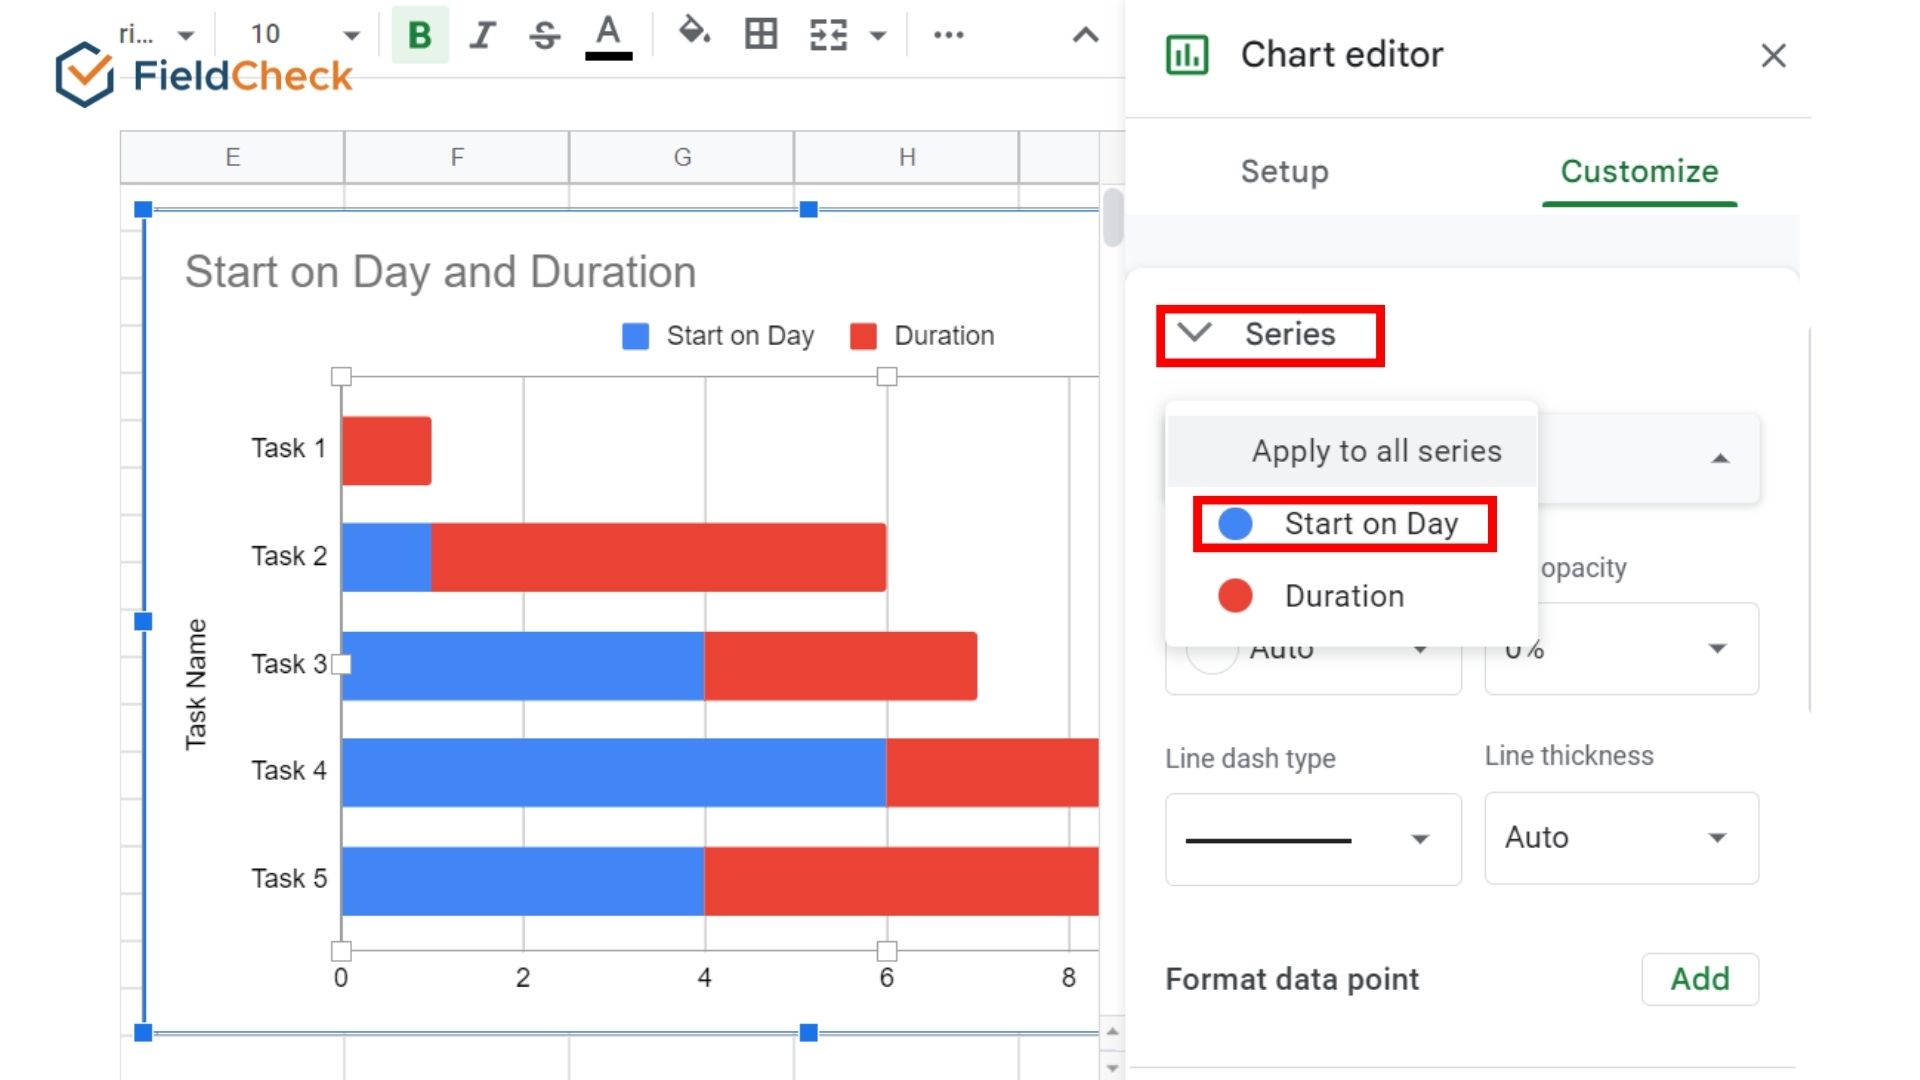
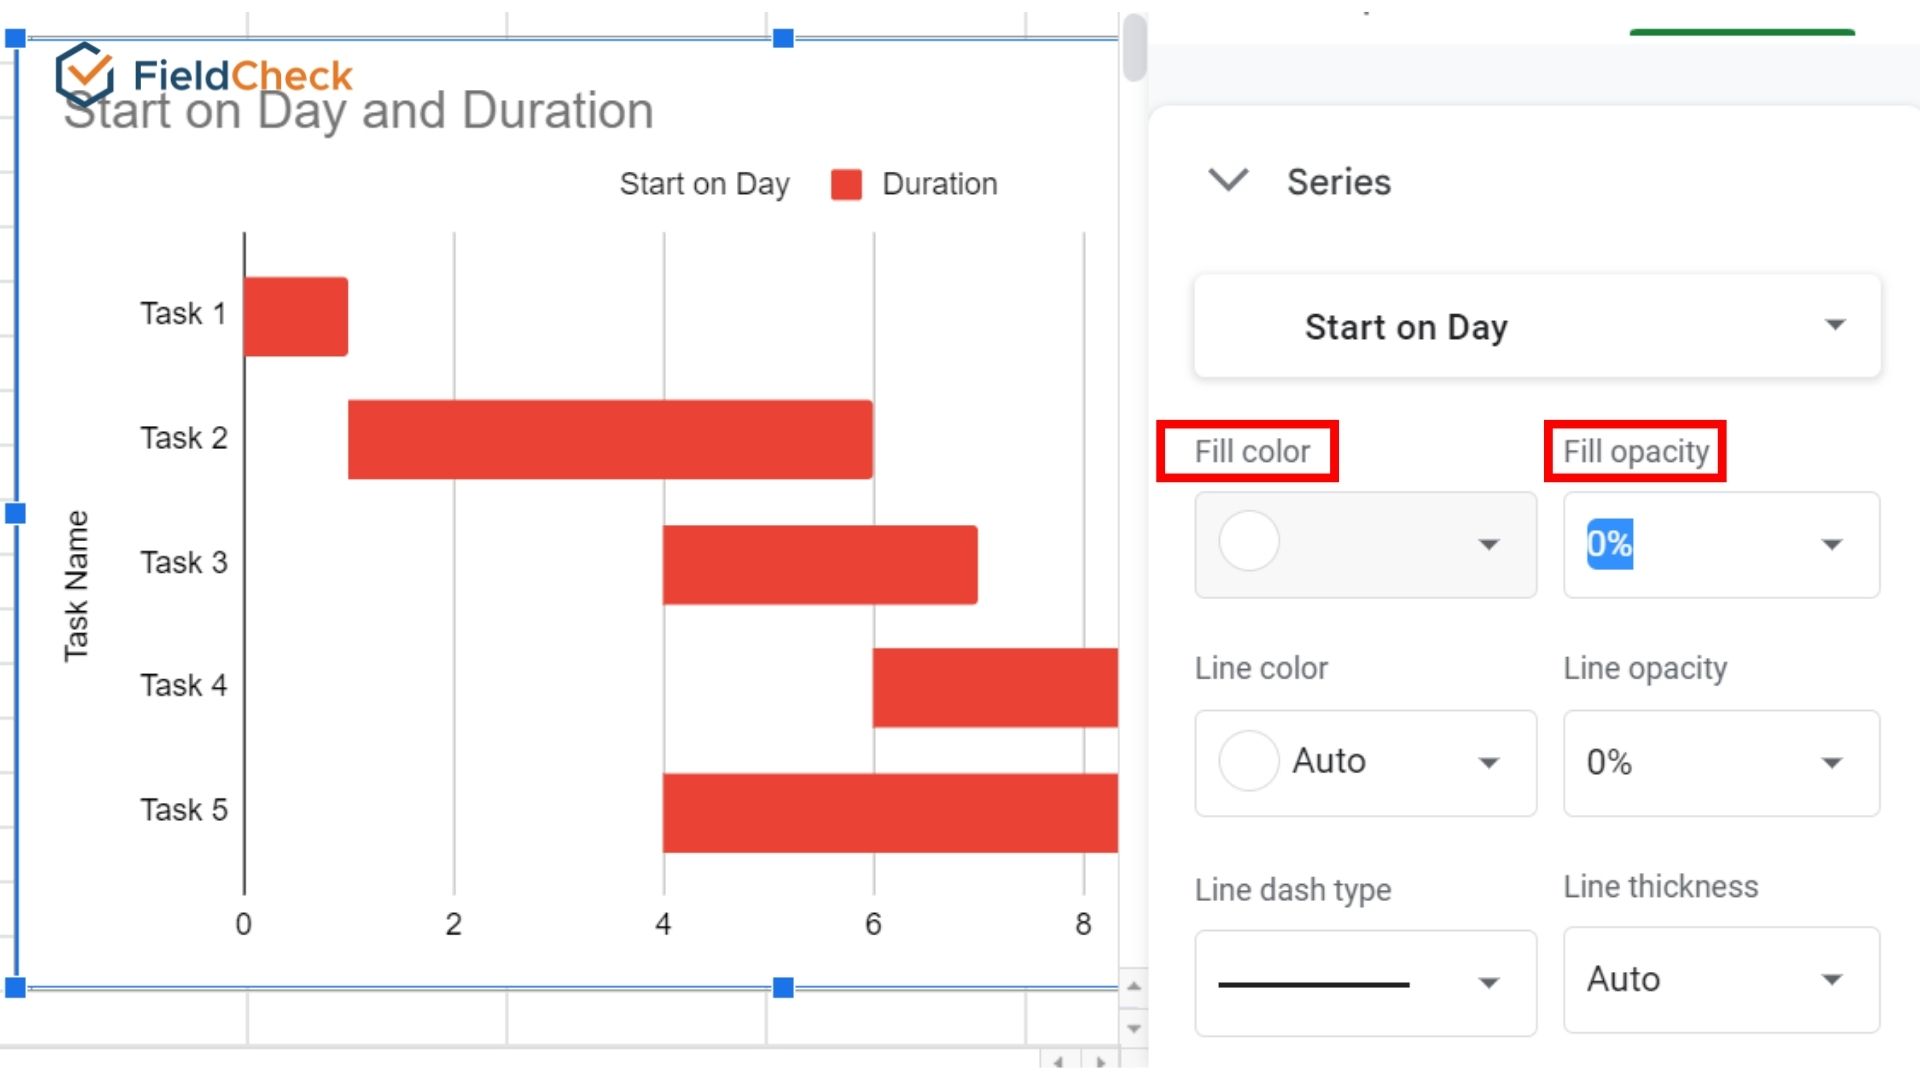
Finally, change "Fill Color" to white and "Opacity" to 0%.
Support Tools For Gantt Charting
1. Canva
One of the free design tools that help you create Gantt charts easily is Canva's Gantt Chart Online. Gantt chart design software provides many professional chart designs for your reference without having to learn complicated software.
In just 5 easy steps, you can visualize data with the many great features of the Gantt chart designer on Canva. In addition, this software also allows embedding your charts in reports and presentations.
Along with that is the sharing feature so that team members and colleagues can access and edit your designs. Canva also supports downloading and printing Gantt charts in high-resolution PNG or PDF format.

Canva.com
2. Zoho Projects
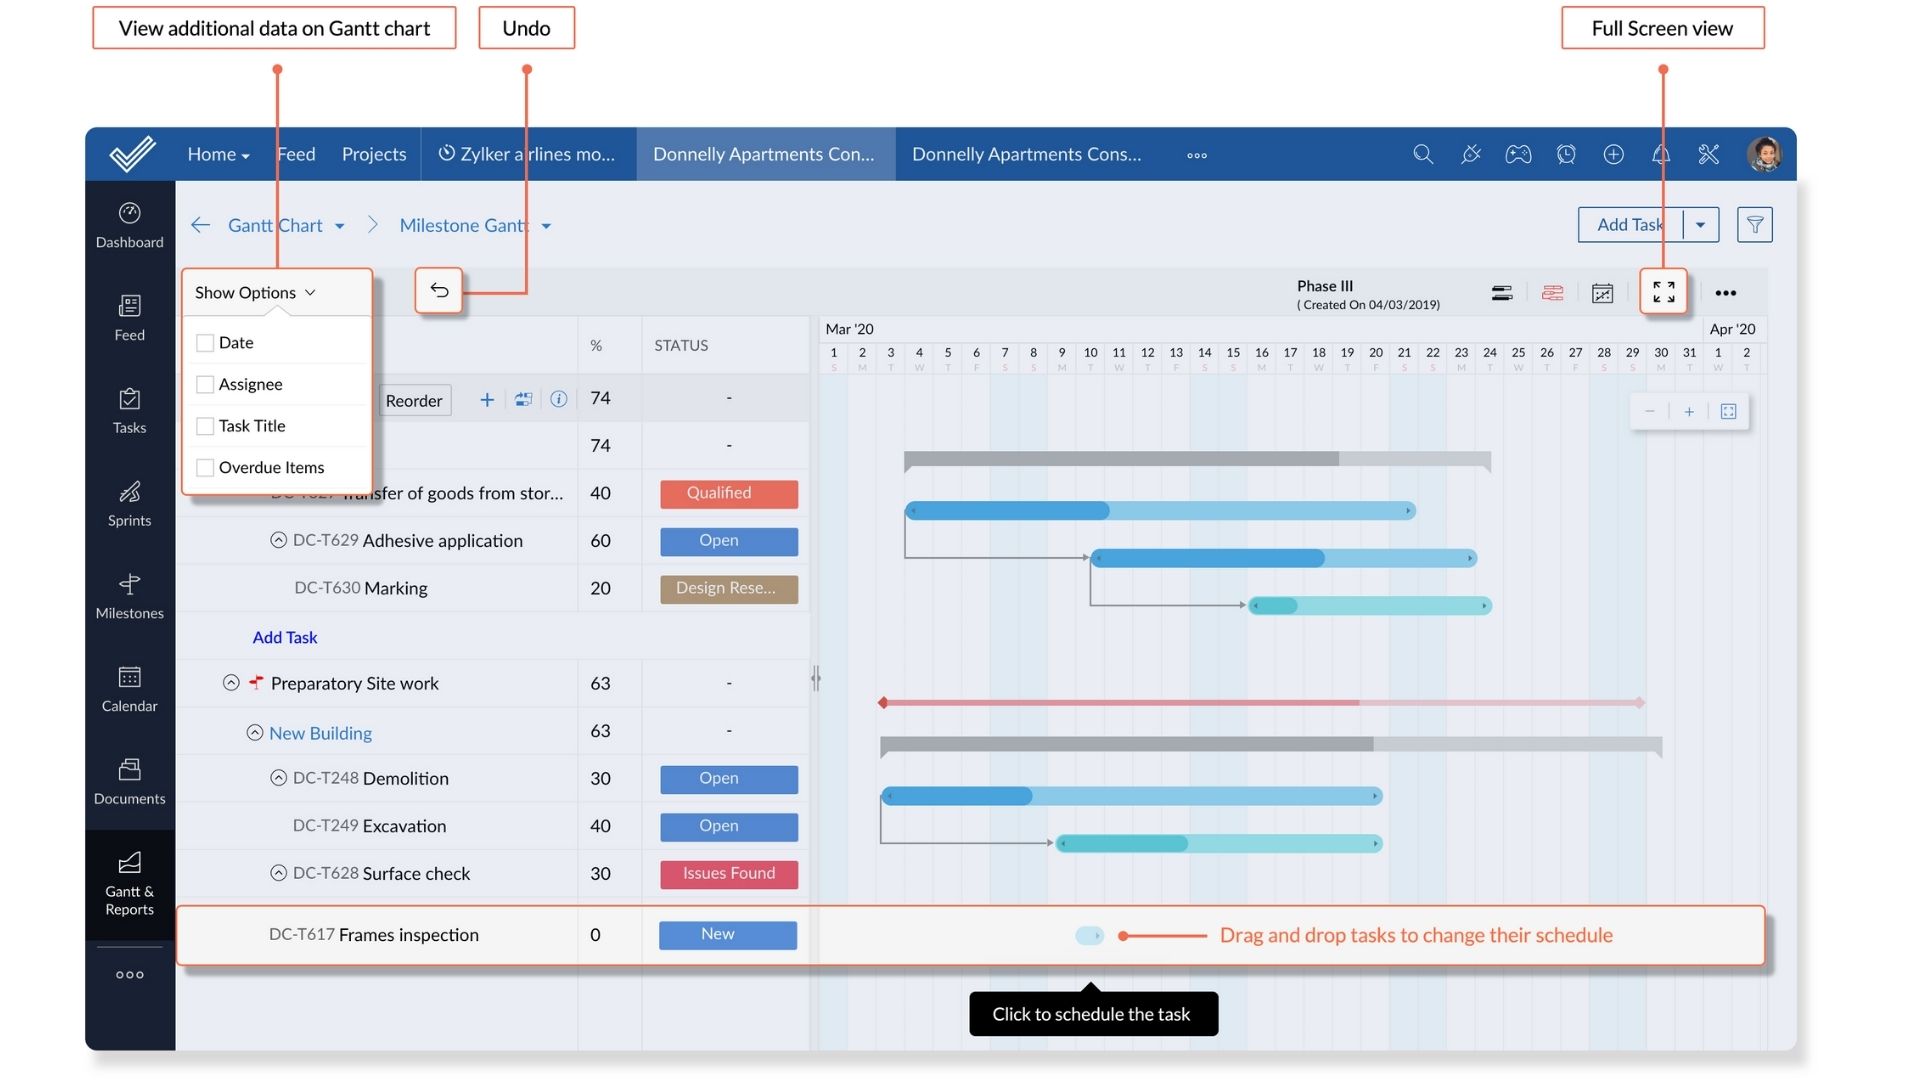
When you use Zoho Projects to draw Gantt charts, you can easily set up and edit dependencies or adjust the time lag between "sequential" tasks.
Zoho lets you reschedule tasks with simple drag-and-drop functionality, with each chart detail, like timelines or progress percentages, color-coded so you can capture them.
Besides, you can save time using the diagram templates available on this software.
3. ClickUp
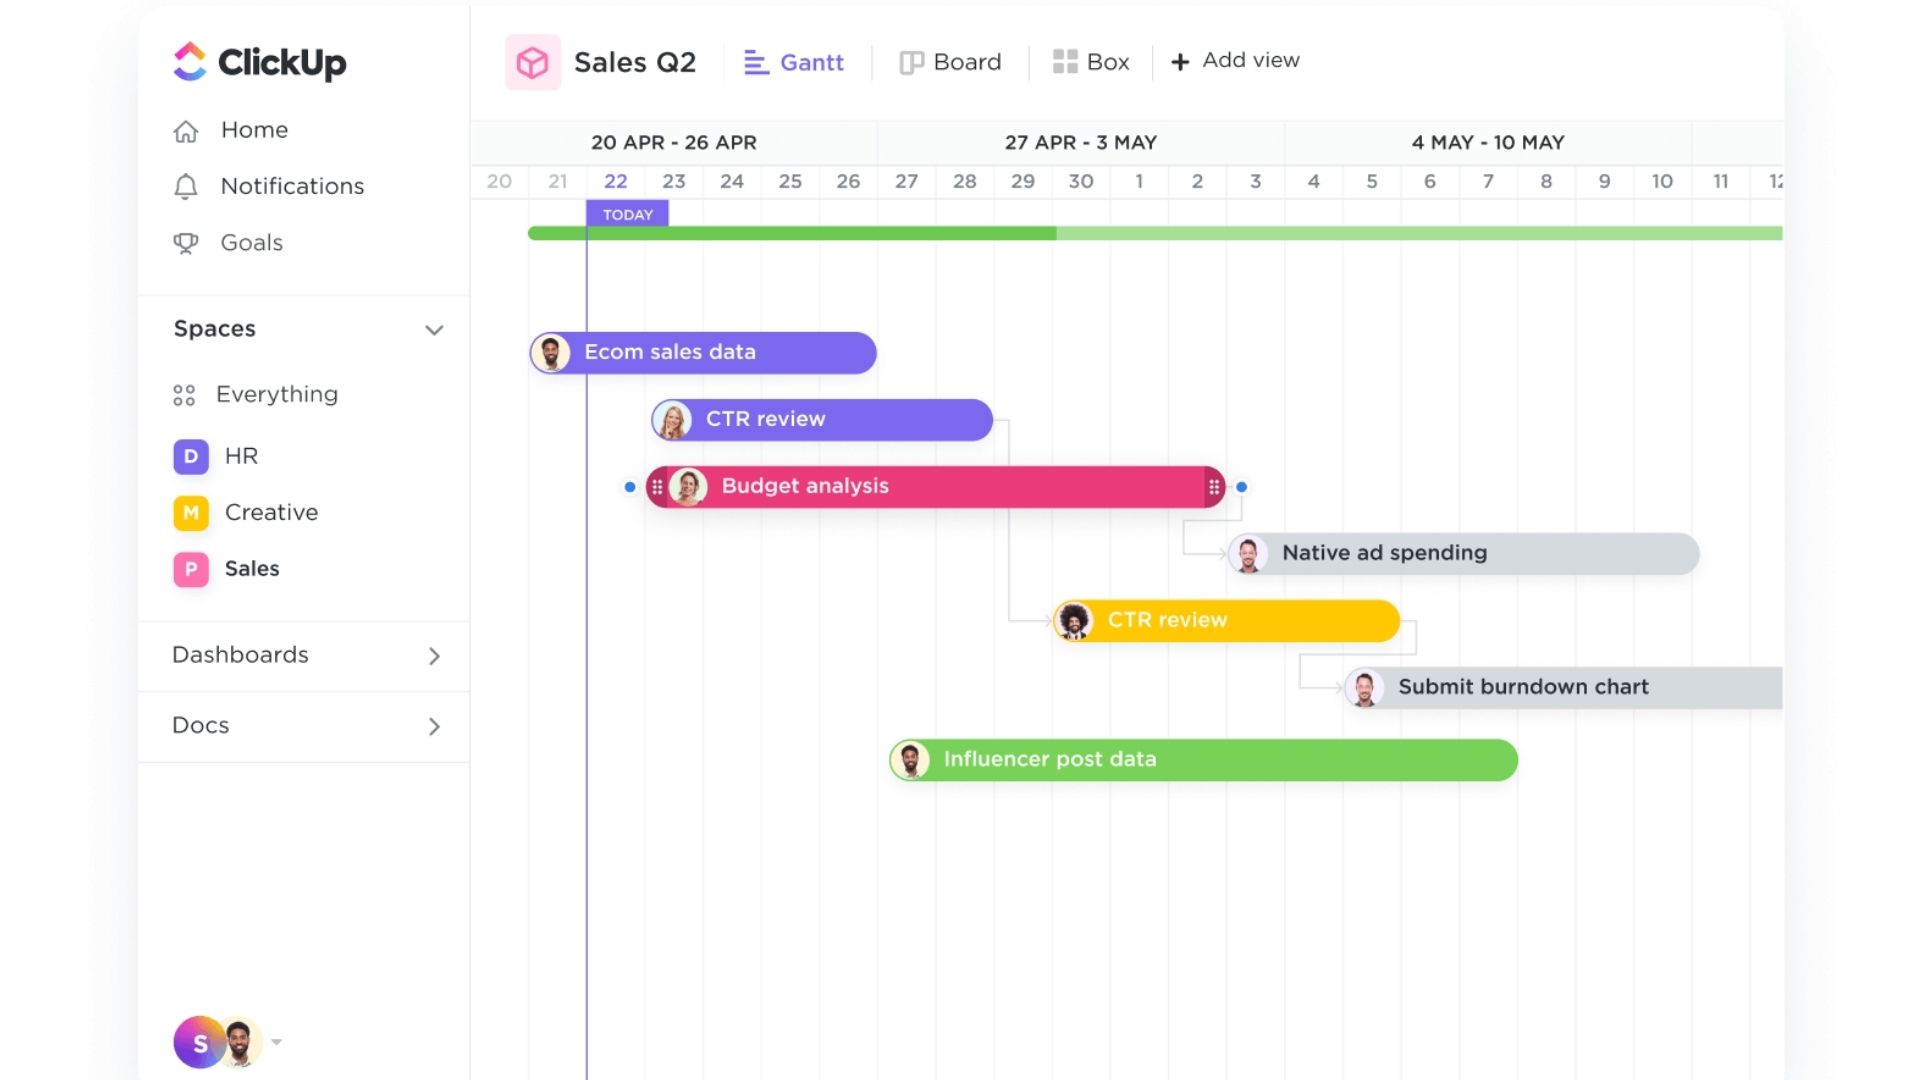
ClickUp is a Gantt chart app with a beautifully designed user interface.
In addition to providing a variety of beautiful patterns and colors, Gantt charts in ClickUp also show intricate details in a clear and organized manner. It allows you to track the completion rate and performance of the whole team. You can also instantly detect any overlap in the graph and use the reporting feature to make corrections.
See more: